Plot
? |
Symb
? |
Source
* |
Average ? |
Thresholds ? |
N_
data |
QC1
parameter |
Data
downloads |
Remarks |
| method |
value |
unit |
method |
value |
| 1 |
• | QC1DB |
MEDIAN |
10.2 |
px |
none | |
90 |
ycenter_ifu09 |
this |
last_yr |
all
|
y centroid of object, ifu 09 |
| 2 |
• | QC1DB |
MEDIAN |
|
px |
none | |
0 |
ycenter_ifu10 |
this |
last_yr |
all
|
y centroid of object, ifu 10 |
| 3 |
• | QC1DB |
MEDIAN |
9.9 |
px |
none | |
88 |
ycenter_ifu11 |
this |
last_yr |
all
|
y centroid of object, ifu 11 |
| 4 |
• | QC1DB |
MEDIAN |
10.1 |
px |
none | |
86 |
ycenter_ifu12 |
this |
last_yr |
all
|
y centroid of object, ifu 12 |
| 5 |
• | QC1DB |
MEDIAN |
|
px |
none | |
0 |
ycenter_ifu13 |
this |
last_yr |
all
|
y centroid of object, ifu 13 |
| 6 |
• | QC1DB |
MEDIAN |
5.49 |
px |
none | |
92 |
ycenter_ifu14 |
this |
last_yr |
all
|
y centroid of object, ifu 14 |
| 7 |
• | QC1DB |
MEDIAN |
4.83 |
px |
none | |
76 |
ycenter_ifu15 |
this |
last_yr |
all
|
y centroid of object, ifu 15 |
| 8 |
• | QC1DB |
MEDIAN |
4.89 |
px |
none | |
90 |
ycenter_ifu16 |
this |
last_yr |
all
|
y centroid of object, ifu 16 |
| |
|
*Data sources: QC1DB: QC1 database; LOCAL: local data source
|
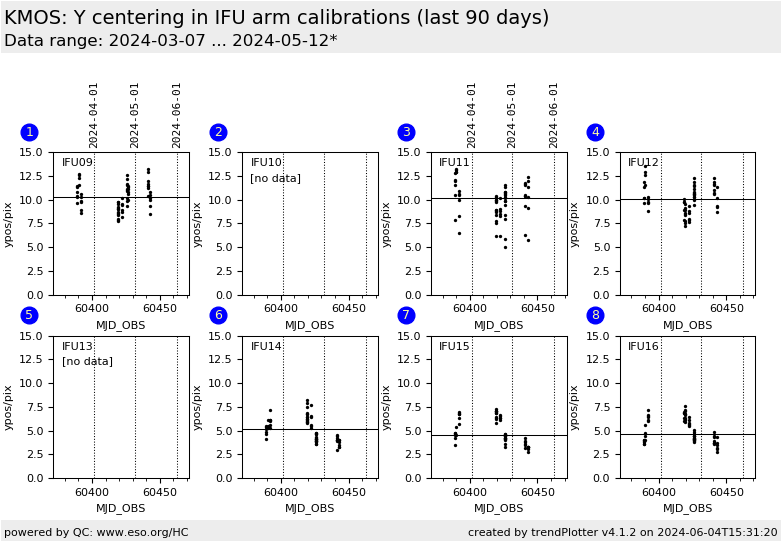
Plot 1
scores: not implemented
| | data source: | kmos_acq
(QC1 database) |
| dataset: | ycenter_ifu09 | • |
| median: | 10.2 | px |
| thresholds: | none | |
| N_data plotted: | 90 |
| [click plot for closeup] |
Plot 2
scores: not implemented
| | data source: | kmos_acq
(QC1 database) |
| dataset: | ycenter_ifu10 | • |
| median: | no data | px |
| thresholds: | none | |
| N_data plotted: | 0 |
| [click plot for closeup] |
Plot 3
scores: not implemented
| | data source: | kmos_acq
(QC1 database) |
| dataset: | ycenter_ifu11 | • |
| median: | 9.9 | px |
| thresholds: | none | |
| N_data plotted: | 88 |
| [click plot for closeup] |
Plot 4
scores: not implemented
| | data source: | kmos_acq
(QC1 database) |
| dataset: | ycenter_ifu12 | • |
| median: | 10.1 | px |
| thresholds: | none | |
| N_data plotted: | 86 |
| [click plot for closeup] |
Plot 5
scores: not implemented
| | data source: | kmos_acq
(QC1 database) |
| dataset: | ycenter_ifu13 | • |
| median: | no data | px |
| thresholds: | none | |
| N_data plotted: | 0 |
| [click plot for closeup] |
Plot 6
scores: not implemented
| | data source: | kmos_acq
(QC1 database) |
| dataset: | ycenter_ifu14 | • |
| median: | 5.49 | px |
| thresholds: | none | |
| N_data plotted: | 92 |
| [click plot for closeup] |
Plot 7
scores: not implemented
| | data source: | kmos_acq
(QC1 database) |
| dataset: | ycenter_ifu15 | • |
| median: | 4.83 | px |
| thresholds: | none | |
| N_data plotted: | 76 |
| [click plot for closeup] |
Plot 8
scores: not implemented
| | data source: | kmos_acq
(QC1 database) |
| dataset: | ycenter_ifu16 | • |
| median: | 4.89 | px |
| thresholds: | none | |
| N_data plotted: | 90 |
| [click plot for closeup] |
Accuracy of IFU postioning (LUT calibrations) as derived from
observations of astrometric fields.
The dotted red line indicates the center (at x, y = 7.5 px);
the solid black line is the median of the measurements.
The median should match with the center.
NOTE: Data points earlier then August 2014 have not been stored in the QC1
database. The median is calculated only for data from August 2014 and later.
General information
Click on any of the plots to see a close-up version.
The latest date is indicated on top of the plot.
If configured,
- data points belonging to the latest date are specially marked
- statistical averages are indicated by a solid line, and thresholds by broken lines
- outliers are marked by a red asterisk. They are defined as data points outside the
threshold lines
- "aliens" (= data points outside the plot Y limits) are marked by a red arrow (↑ or ↓)
- you can download the data for each parameter set if the 'Data downloads' link shows up
|
