Plot
? |
Symb
? |
Source
* |
Average ? |
Thresholds ? |
N_
data |
QC1
parameter |
Data
downloads |
Remarks |
| method |
value |
unit |
method |
value |
| 1 |
• | QC1DB |
none |
|
|
none | |
54 |
twil2lamp_UL |
this |
last_yr |
all
|
S13, J,H,Ks |
| 1 |
• | QC1DB |
none |
|
|
none | |
11 |
twil2lamp_UL |
this |
last_yr |
all
|
S27, J,H,Ks |
| 1 |
• | QC1DB |
none |
|
|
none | |
5 |
twil2lamp_UL |
this |
last_yr |
all
|
S54, J,H,Ks |
| 2 |
• | QC1DB |
none |
|
|
none | |
54 |
twil2lamp_UR |
this |
last_yr |
all
|
S13, J,H,Ks |
| 2 |
• | QC1DB |
none |
|
|
none | |
11 |
twil2lamp_UR |
this |
last_yr |
all
|
S27, J,H,Ks |
| 2 |
• | QC1DB |
none |
|
|
none | |
5 |
twil2lamp_UR |
this |
last_yr |
all
|
S54, J,H,Ks |
| 3 |
• | QC1DB |
none |
|
|
none | |
54 |
twil2lamp_LL |
this |
last_yr |
all
|
S13, J,H,Ks |
| 3 |
• | QC1DB |
none |
|
|
none | |
11 |
twil2lamp_LL |
this |
last_yr |
all
|
S27, J,H,Ks |
| 3 |
• | QC1DB |
none |
|
|
none | |
5 |
twil2lamp_LL |
this |
last_yr |
all
|
S54, J,H,Ks |
| 4 |
• | QC1DB |
none |
|
|
none | |
54 |
twil2lamp_LR |
this |
last_yr |
all
|
S13, J,H,Ks |
| 4 |
• | QC1DB |
none |
|
|
none | |
11 |
twil2lamp_LR |
this |
last_yr |
all
|
S27, J,H,Ks |
| 4 |
• | QC1DB |
none |
|
|
none | |
5 |
twil2lamp_LR |
this |
last_yr |
all
|
S54, J,H,Ks |
| |
|
*Data sources: QC1DB: QC1 database; LOCAL: local data source
|
Plot 1
scores: not implemented
| | data source: | naco_twflat
(QC1 database) |
dataset:
(numbers below apply to this dataset) | twil2lamp_UL | • |
| average: | none |
| thresholds: | none |
| N_data plotted: | 54 |
| [click plot for closeup] |
Plot 2
scores: not implemented
| | data source: | naco_twflat
(QC1 database) |
dataset:
(numbers below apply to this dataset) | twil2lamp_UR | • |
| average: | none |
| thresholds: | none |
| N_data plotted: | 54 |
| [click plot for closeup] |
Plot 3
scores: not implemented
| | data source: | naco_twflat
(QC1 database) |
dataset:
(numbers below apply to this dataset) | twil2lamp_LL | • |
| average: | none |
| thresholds: | none |
| N_data plotted: | 54 |
| [click plot for closeup] |
Plot 4
scores: not implemented
| | data source: | naco_twflat
(QC1 database) |
dataset:
(numbers below apply to this dataset) | twil2lamp_LR | • |
| average: | none |
| thresholds: | none |
| N_data plotted: | 54 |
| [click plot for closeup] |
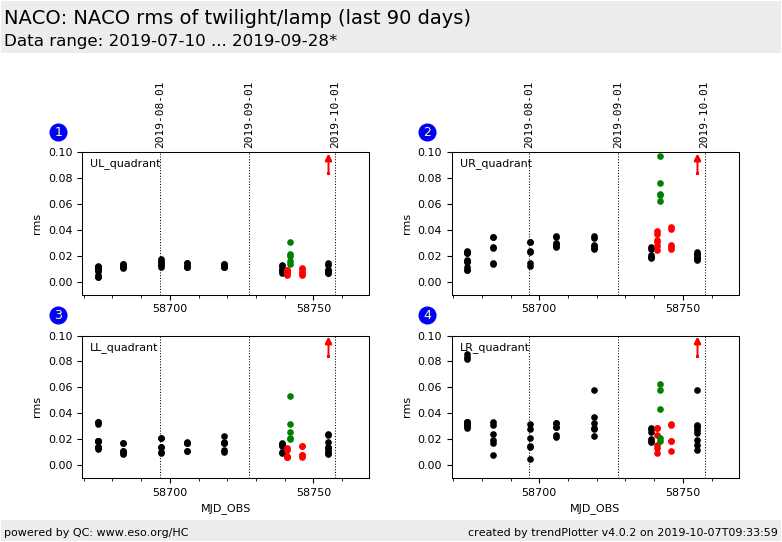
In the NACO calibration plan for SW band filters (J,H Ks, ... (not L_prime, M_prime ...)),
lamp flats are used to calibrate the science, while twilight flats serve as a technical calibration to check
if it is justified to use lamp flats. For reasons to validate this assumption the master twilight flat is divided by the master lamp flat of the same
read mode, filter and camera. This plot shows the RMS of the ratio product. Analysis regions are identical to those used for the bad pixel monitoring.
General information
Click on any of the plots to see a close-up version.
The latest date is indicated on top of the plot.
If configured,
- data points belonging to the latest date are specially marked
- statistical averages are indicated by a solid line, and thresholds by broken lines
- outliers are marked by a red asterisk. They are defined as data points outside the
threshold lines
- "aliens" (= data points outside the plot Y limits) are marked by a red arrow (↑ or ↓)
- you can download the data for each parameter set if the 'Data downloads' link shows up
|
