Plot
? |
Symb
? |
Source
* |
Average ? |
Thresholds ? |
N_
data |
QC1
parameter |
Data
downloads |
Remarks |
| method |
value |
unit |
method |
value |
| 1 |
• | QC1DB |
MEDIAN |
1.66e+04 |
ADU |
VAL | 10000.,55000. |
16 |
qc_raw_twilight_median |
this |
last_yr |
all
|
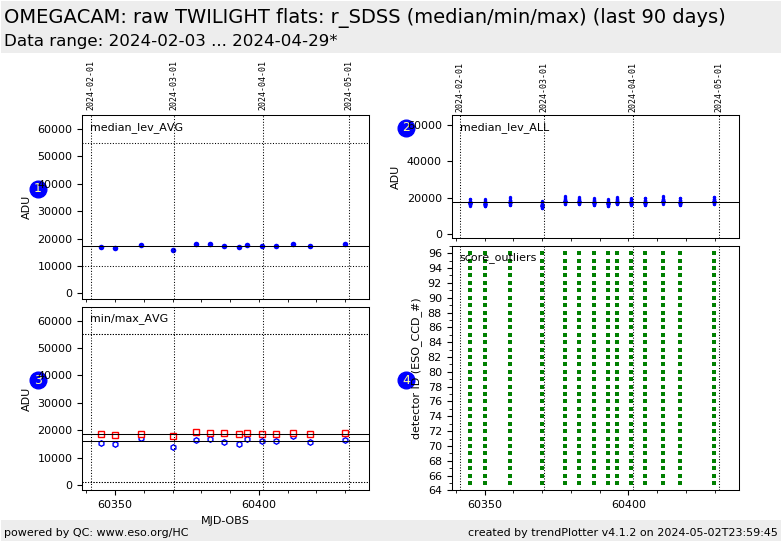
r_SDSS: median level in raw TWILIGHT flats averaged over all 32 detectors (ADU) |
| 2 |
• | QC1DB |
MEDIAN |
1.65e+04 |
ADU |
none | |
512 |
qc_raw_twilight_median |
this |
last_yr |
all
|
r_SDSS: median level in raw TWILIGHT flats for each individual detector (ADU) |
| 3 |
o | QC1DB |
MEDIAN |
1.47e+04 |
ADU |
VAL | 1000.,55000. |
16 |
qc_raw_twilight_min |
this |
last_yr |
all
|
r_SDSS: level of raw TWILIGHT flat with the minimum flux averaged over all detectors (ADU) |
| 3 |
□ | QC1DB |
MEDIAN |
1.85e+04 |
ADU |
VAL | 1000.,55000. |
16 |
qc_raw_twilight_max |
this |
last_yr |
all
|
r_SDSS: level of raw TWILIGHT flat with the maximum flux averaged over all detectors (ADU) |
| 4 |
■ | LOCAL |
none |
|
none |
none | |
512 |
det_id |
n/a |
score per detector:
GREEN = within the thresholds |
| 4 |
■ | LOCAL |
none |
|
none |
none | |
0 |
det_id |
n/a |
score per detector:
RED = beyond the thresholds |
| |
|
*Data sources: QC1DB: QC1 database; LOCAL: local data source
|
Plot 1
scores:  2| 2|
| | data source: | omegacam_twilight
(QC1 database) |
| dataset: | qc_raw_twilight_median | • |
| median: | 1.66e+04 | ADU |
| fixed thresholds: | 10000.0...55000.0 | ADU |
| N_data plotted: | 16 |
| [click plot for closeup] |
Plot 2
scores: not implemented
| | data source: | omegacam_twilight
(QC1 database) |
| dataset: | qc_raw_twilight_median | • |
| median: | 1.65e+04 | ADU |
| thresholds: | none | |
| N_data plotted: | 512 |
| [click plot for closeup] |
Plot 3
scores: multiple dataset, cannot be scored
| | data source: | omegacam_twilight
(QC1 database) |
dataset:
(numbers below apply to this dataset) | qc_raw_twilight_min | o |
| median: | 1.47e+04 | ADU |
| fixed thresholds: | 1000.0...55000.0 | ADU |
| N_data plotted: | 16 |
| [click plot for closeup] |
Plot 4
scores: not implemented
| | data source: | local data source
|
dataset:
(numbers below apply to this dataset) | det_id | ■ |
| average: | none |
| thresholds: | none |
| N_data plotted: | 512 |
| [click plot for closeup] |
Trending plots for raw TWILIGHT flats: r_SDSS .
QC parameters are derived from each of 32 detectors of OmegaCAM
TWILIGHT flat frames.
The raw frames are used to judge the twilight flat flux levels since
all of the pipeline products (i.e. MASTER_TWILIGHT_FLAT) are
normalized and, hence, this information is lost.
DB Name: omegacam_dome
Fits header: QC.RAW.TWILIGHT.MEDIAN / QC.RAW.TWILIGHT.MIN / QC.RAW.TWILIGHT.MAX
QC1 DB: qc_raw_twilight_median / qc_raw_twilight_min / qc_raw_twilight_max
Description:
The raw twilight flat flux levels as measured from the twilight flat
pipeline product frame MASTER_FLAT and MASTER_FLAT_TWILIGHT
Setup:
BIN.X / BIN.Y / READ.MODE / READ.SPEED = 1/1/normal/normal
These Health Check plots describe:
Fig. 1 median_lev_AVG: The median flux level of all of
the input raw twilight flats averaged over all 32 detectors (in ADU).
This plot is sensitive to any changes common to all detectors.
Fig. 2 median_lev_ALL: The median flux level of all of the input raw twilight flats
for each individual detector (in ADU). This plot is sensitive changes in individual
detectors.
Fig. 3 min_AVG: The median flux level of the raw twilight flat
having the minimum flux level averaged over all 32 detectors (in
ADU) [blue circles].
max_AVG: The median flux level of the raw twilight flat
having the maximum flux level averaged over all 32 detectors (in ADU) [red squares].
Fig. 4 score_outliers: Scores of the raw twilight flat median level as
measured for each of the 32 detectors.
Green = within the defined thresholds.
Red = beyond the defined thresholds.
OmegaCAM detector plane layout (detector_ID locations):

General information
Click on any of the plots to see a close-up version.
The latest date is indicated on top of the plot.
If configured,
- data points belonging to the latest date are specially marked
- statistical averages are indicated by a solid line, and thresholds by broken lines
- outliers are marked by a red asterisk. They are defined as data points outside the
threshold lines
- "aliens" (= data points outside the plot Y limits) are marked by a red arrow (↑ or ↓)
- you can download the data for each parameter set if the 'Data downloads' link shows up
|
