Plot
? |
Symb
? |
Source
* |
Average ? |
Thresholds ? |
N_
data |
QC1
parameter |
Data
downloads |
Remarks |
| method |
value |
unit |
method |
value |
| 1 |
• | QC1DB |
none |
|
NONE |
none | |
25 |
qc_eff_median |
this |
last_yr |
all
|
efficiency J-band (averaged on bins) |
| 2 |
• | QC1DB |
none |
|
NONE |
none | |
27 |
qc_eff_median |
this |
last_yr |
all
|
efficiency H-band |
| 3 |
• | QC1DB |
none |
|
NONE |
none | |
29 |
qc_eff_median |
this |
last_yr |
all
|
efficiency K-band |
| 4 |
• | QC1DB |
none |
|
NONE |
none | |
24 |
qc_eff_median |
this |
last_yr |
all
|
efficiency HK-band |
|
| 5 |
• | QC1DB |
none |
|
NONE |
none | |
105 |
qc_eff_median0 |
this |
last_yr |
all
|
median for each bin, all band |
| 5 |
• | QC1DB |
none |
|
NONE |
none | |
105 |
qc_eff_median1 |
this |
last_yr |
all
|
median for each bin, all band |
| 5 |
• | QC1DB |
none |
|
NONE |
none | |
105 |
qc_eff_median2 |
this |
last_yr |
all
|
median for each bin, all band |
| 5 |
• | QC1DB |
none |
|
NONE |
none | |
105 |
qc_eff_median3 |
this |
last_yr |
all
|
median for each bin, all band |
| 5 |
• | QC1DB |
none |
|
NONE |
none | |
51 |
qc_eff_median4 |
this |
last_yr |
all
|
median for each bin, all band |
|
| |
|
*Data sources: QC1DB: QC1 database; LOCAL: local data source
|
Plot 1
scores: not implemented
| | data source: | sinfoni_efficiency
(QC1 database) |
| dataset: | qc_eff_median | • |
| average: | none |
| thresholds: | none |
| N_data plotted: | 25 |
| [click plot for closeup] |
Plot 2
scores: not implemented
| | data source: | sinfoni_efficiency
(QC1 database) |
| dataset: | qc_eff_median | • |
| average: | none |
| thresholds: | none |
| N_data plotted: | 27 |
| [click plot for closeup] |
Plot 3
scores: not implemented
| | data source: | sinfoni_efficiency
(QC1 database) |
| dataset: | qc_eff_median | • |
| average: | none |
| thresholds: | none |
| N_data plotted: | 29 |
| [click plot for closeup] |
Plot 4
scores: not implemented
| | data source: | sinfoni_efficiency
(QC1 database) |
| dataset: | qc_eff_median | • |
| average: | none |
| thresholds: | none |
| N_data plotted: | 24 |
| [click plot for closeup] |
Plot 5
scores: not implemented
| | data source: | sinfoni_efficiency
(QC1 database) |
dataset:
(numbers below apply to this dataset) | qc_eff_median0 | • |
| average: | none |
| thresholds: | none |
| N_data plotted: | 105 |
| [click plot for closeup] |
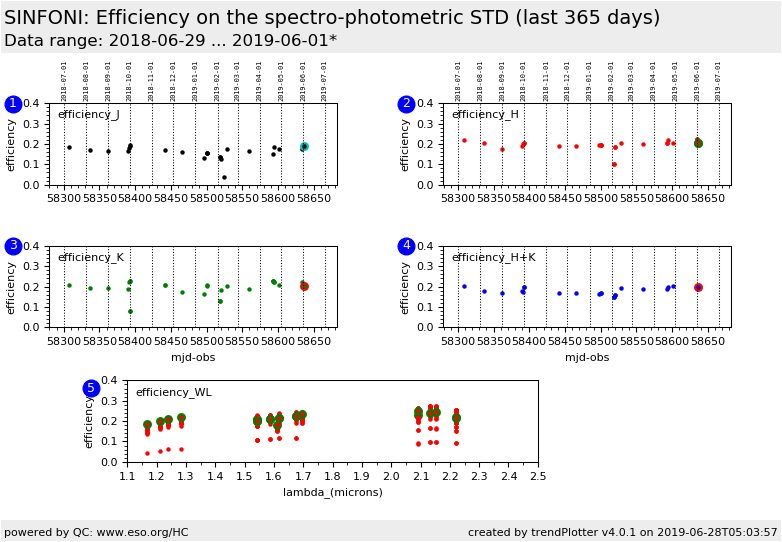
These are the trending plots for the SINFONI QC parameters derived
from the Spectro-photometric STD stars.
Spectro photometric standard star monitoring has been implemented beginning 2017-03.
The intent is to monitor the efficiency of the instrument.
The list of spectro-photometric STD is the same than XSHOOTER.
Several bins are defined for each Band to calculate the efficiency.
S1_J 1.16604 1.17199
S1_J 1.21302 1.22695
S1_J 1.24 1.24797
S1_J 1.28306 1.29205
S2_H 1.541 1.54801
S2_H 1.541 1.56303
S2_H 1.58604 1.59501
S2_H 1.61704 1.63401
S2_H 1.674 1.686
S4_H+K 1.541 1.548
S4_H+K 1.611 1.642
S4_H+K 1.696 1.708
S4_H+K 2.092 2.099
S4_H+K 2.221 2.242
S3_K 2.09098 2.09808
S3_K 2.13189 2.14806
S3_K 2.15198 2.16105
S3_K 2.22107 2.23798
Other QC parameters are also trended
here.
General information
Click on any of the plots to see a close-up version.
The latest date is indicated on top of the plot.
If configured,
- data points belonging to the latest date are specially marked
- statistical averages are indicated by a solid line, and thresholds by broken lines
- outliers are marked by a red asterisk. They are defined as data points outside the
threshold lines
- "aliens" (= data points outside the plot Y limits) are marked by a red arrow (↑ or ↓)
- you can download the data for each parameter set if the 'Data downloads' link shows up
|
