mirror sites: PL (internal link) HQ     [?]

Health Check monitor


CAL | HC | refs | QC
HealthCheck Monitor
   HOME | UsersGuide
  sl icon ALL INSTRUMENTS
 
all KPI reports
VISIR:
background
Other HC:
QC links:
        [page auto-refreshes after 300 sec]   [stop | on]            [press Ctrl+Shift+R to enforce refresh of scores, dates and news]
VISIR trending system: HEALTH CHECK report
HELP USERS-GUIDE MORE
Last update: 2015-02-12T09:51:16 (UT)
  | now: 2024-05-14T05:31:54 (UT) muc03 QC pipeline: visir-4.0.3 (installed 2015-01-09)
same group: background
General news: NOTE: The Health Check and calChecker services are moved to qcFlow on an instrument by instrument basis. The current pages will not be updated any longer once the move has been finished.
The links to KMOS, UVES, and ESPRESSO have been moved to a new section (qcFlow operational) at the lower part of the navigation bar.
VISIR news:  
Report news:
DATE*: [?] 2024-05-07
report | NLT
2024-05-08
report | NLT
2024-05-09
report | NLT
2024-05-10
report | NLT
2024-05-11
report | NLT
2024-05-12
report | NLT
2024-05-13
report | NLT
r...
Raw CAL displays:
raw raw raw raw raw raw raw
P...
CAL product quality:
products products products products products products products
     

scores&comments | history ... | plot tutorial ... | contact                 daily/often; important to check     [?]
*Date on this monitor changes at 21:00 UT
Print: Information and research:
- png file - advanced studies: QC1 browser | QC1 plotter
Plot
?
Symb
?
Source
*
Average ? Thresholds ? N_
data
QC1
parameter
Data
downloads
Remarks
method value unit method value
1 QC1DB MEDIAN 1.59e+03 mJy/1hr none  44 backgd_mean this | last_yr | all mean background for the SF, pfov=0.075
2 QC1DB MEDIAN 2.04e+03 mJy/1hr none  39 backgd_mean this | last_yr | all mean background for the IF, pfov=0.127
*Data sources: QC1DB: QC1 database; LOCAL: local data source
Plot 1
scores: not implemented
data source:visir_zp_img
(QC1 database)
dataset:backgd_mean
median:1.59e+03mJy/1hr
thresholds:none 
N_data plotted:44
[click on plot for closeup]
Plot 2
scores: not implemented
data source:visir_zp_img
(QC1 database)
dataset:backgd_mean
median:2.04e+03mJy/1hr
thresholds:none 
N_data plotted:39
[click on plot for closeup]
This plot

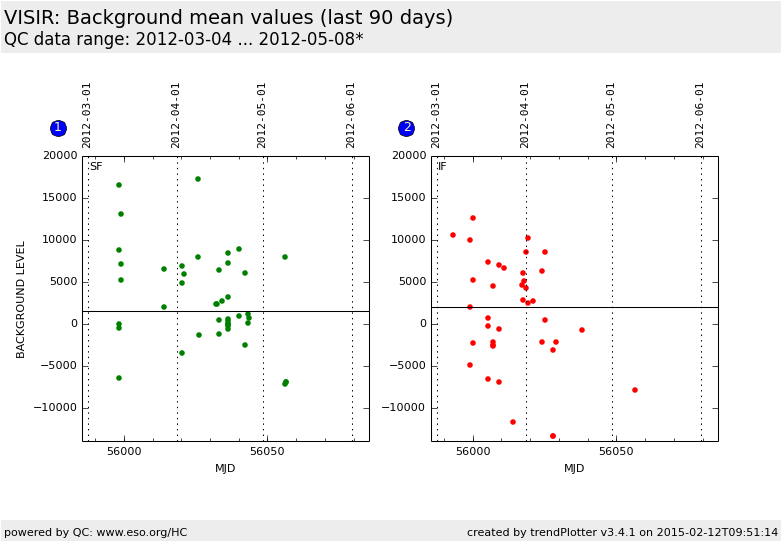
Historical mean background values from imaging standard star observations using the pre-upgrade detector. Only data taken with the PAH1 filter are selected. The plot is separated into small-field (SF) pixel field of view (0.075 arcsec/pixel) and intermediate-field (IF) pixel field of view (0.127 arcsec/pixel). The background level is determined from the half-cycle frames where no offset correction (32768 value added for each pixel) was applied.  


General information

Click on any of the plots to see a close-up version.

The latest date is indicated on top of the plot.

If configured,

  • data points belonging to the latest date are specially marked
  • statistical averages are indicated by a solid line, and thresholds by broken lines
  • outliers are marked by a red asterisk. They are defined as data points outside the threshold lines
  • "aliens" (= data points outside the plot Y limits) are marked by a red arrow ( or )
  • you can download the data for each parameter set if the 'Data downloads' link shows up