| This documentation is intended both for QC scientists and SciOps astronomers (who may want to ignore the technical information displayed in grey). | ||||||||||||||||||||||||||||
|
||||||||||||||||||||||||||||
|
||||||||||||||||||||||||||||
| bottom plots | contact | ||||||||||||||||||||||||||||
| NAME | std_arg.prg | |||||||||||||||||||||||||||
| VERSION |
1.0 -- copied from science.prg (May 2005) 1.1 -- adapted to new CCD, scoreQC included (2008-05-28) 1.2 -- efficiency now separate product (2008-07-17) | |||||||||||||||||||||||||||
| SYNTAX | MIDAS | |||||||||||||||||||||||||||
| CALL | processQC -a ab_name | |||||||||||||||||||||||||||
| INSTRUMENT | GIRAFFE | |||||||||||||||||||||||||||
| RAWTYPE | STD_ARG (Argus standard star) | |||||||||||||||||||||||||||
| PURPOSE | compares raw and product STD files for FLAMES_GIRAFFE QC assessment; QC1 values are calculated, a QC1 plot is generated, displays are generated. The QC1 data are fed into the QC1 database. | |||||||||||||||||||||||||||
| PROCINPUT | STD_RBNSPECTRA, EFFICIENCY_CURVE | |||||||||||||||||||||||||||
| QC1TABLE |
trending | table(s) in QC1 database: giraffe_std | |||||||||||||||||||||||||||
| TRENDPLOT |
trending | HealthCheck plot(s) associated to this procedure: ../FULL/trend_report_SYSTEM_EFFIC_HC.html | ../FULL/trend_report_SYSTEM_EFFIC_WLN_HC.html | |||||||||||||||||||||||||||
| QC1PAGE |
trending | associated documentation: std_qc1.html | |||||||||||||||||||||||||||
| QC1PLOTS top |
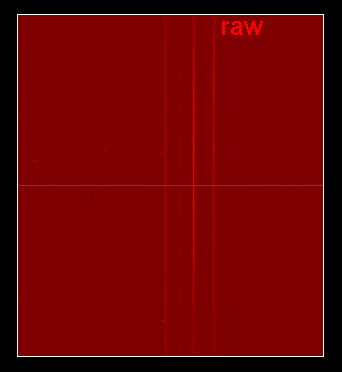
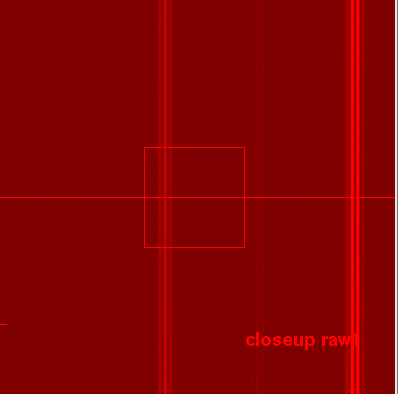
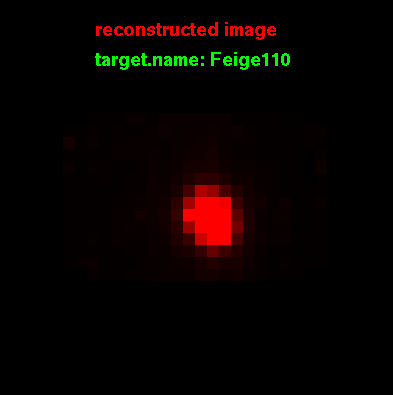
std_arg1.gif box1:crosscut (middle row) through the raw file (red: mbias level); there should be a few fibres illuminated box2a:histogram (log) of raw file (as another check for signal) box2b:raw-bias, should show parabolic peak at 0, not shifted box3:extracted spectrum (not flattened), all fibres collapsed box4:efficiency curve, before (black) and after (red) sky correction; the sky correction factor is displayed at bottom std_arg2.png full display of raw frame; box: area displayed in std_arg3.png std_arg3.png closeup of raw frame, a few fibres should display a signal std_arg4.png reconstructed image displaying the STD star std_arg5.png fibre tracing plots (there are actually 4), with SKY and SIMCAL fibres marked in blue | |||||||||||||||||||||||||||
| QC1PARAM |
QC1 parameters written into QC1 table: QC1_db names: num_fib | mean_signal | obs_targ_name | airmass | seeing | mean_effic | qc_numsat FITS key names: PRO.SLIT.NFIBRES | [calculated] | OBS.TARG.NAME | TEL.AIRM.START/END | TEL.AMBI.FWHM.START/END | [calculated] | [calculated] QC1 parameters calculated by the pipeline: mean_signal | mean_effic | qc_numsat | |||||||||||||||||||||||||||
| ALGORITHM | mean_signal, mean_effic: stat/ima; qc_numsat: count all pixels > 60.000 | |||||||||||||||||||||||||||
| CERTIF |
Reasons for rejection: - scoring alerts, in particular saturation - no target visible in reconstructed image | |||||||||||||||||||||||||||
| COMMENTS |
Scoring: mean_signal | mean_effic | num_fib | qc_numsat ABs fail if target not in catalog section MARK_TRACINGS is called in science.prg | |||||||||||||||||||||||||||
| top | [2015-10-29T10:06:35] created by qcDocu v1.1.2, a tqs tool | |||||||||||||||||||||||||||