Plot
? |
Symb
? |
Source
* |
OPS?
** |
Average ? |
Thresholds ? |
N_
data |
QC1
parameter |
Data
downloads |
Remarks |
| method |
value |
unit |
method |
value |
| 1 |
• | QC1DB |
no |
MEDIAN |
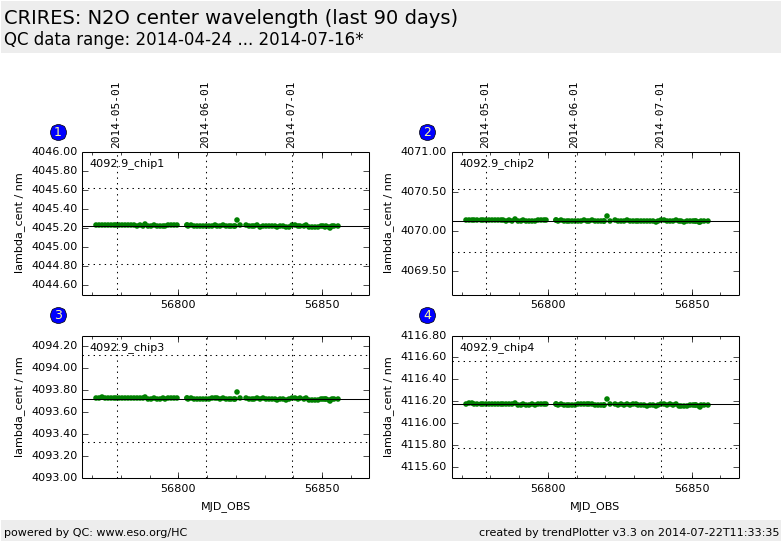
4045.224 |
nm |
OFF | ± 0.4 |
86 |
lambda_cent |
this |
last_yr |
all
|
center wavelength on chip 1, WREF=4092.9 |
| 2 |
• | QC1DB |
no |
MEDIAN |
4070.135 |
nm |
OFF | ± 0.4 |
86 |
lambda_cent |
this |
last_yr |
all
|
center wavelength on chip 2, WREF=4092.9 |
| 3 |
• | QC1DB |
no |
MEDIAN |
4093.726 |
nm |
OFF | ± 0.4 |
86 |
lambda_cent |
this |
last_yr |
all
|
center wavelength on chip 3, WREF=4092.9 |
| 4 |
• | QC1DB |
no |
MEDIAN |
4116.172 |
nm |
OFF | ± 0.4 |
86 |
lambda_cent |
this |
last_yr |
all
|
center wavelength on chip 4, WREF=4092.9 |
| |
|
*Data sources: QC1DB: QC1 database; LOCAL: local text file | **OPS: OPSLOG data are included
|
Plot 1
scores:  9| 9|
| | data source: | crires_wave
(QC1 database) |
| dataset: | lambda_cent | • |
| median: | 4045.224 | nm |
| rel. thresholds: | 4044.823877...4045.623877 | nm |
| N_data plotted: | 86 |
| [click on plot for closeup] |
Plot 2
scores: 9|
| | data source: | crires_wave
(QC1 database) |
| dataset: | lambda_cent | • |
| median: | 4070.135 | nm |
| rel. thresholds: | 4069.734766...4070.534766 | nm |
| N_data plotted: | 86 |
| [click on plot for closeup] |
Plot 3
scores: 9|
| | data source: | crires_wave
(QC1 database) |
| dataset: | lambda_cent | • |
| median: | 4093.726 | nm |
| rel. thresholds: | 4093.325586...4094.125586 | nm |
| N_data plotted: | 86 |
| [click on plot for closeup] |
Plot 4
scores: 9|
| | data source: | crires_wave
(QC1 database) |
| dataset: | lambda_cent | • |
| median: | 4116.172 | nm |
| rel. thresholds: | 4115.771875...4116.571875 | nm |
| N_data plotted: | 86 |
| [click on plot for closeup] |
Wavelength calibration: trending of central wavelength.
The central wavelength is monitored for the two daily health check settings
with reference wavelengths (on chip 3) of 1090.4nm using ThAr lamp and 4092.9nm
using N2O absorption cell. This plot shows the results with N2O.
The center wavelength should be stable on each chip. A shift of 0.01 nm
corresponds to a shift of 0.56 pixels. The variation of the central wavelength
should be less than about 5 pixels.
Pipeline processing in Garching applies dark subtraction, flat fielding, and
slightly different recipe parameters compared to the Paranal online pipeline.
Wavelength solutions from processing on Paranal are currently (as of Feb 2010) incorrect
and are omitted from plotting.
General information
Click on any of the plots to see a close-up version.
The latest date is indicated on top of the plot, data points belonging to that date are specially marked.
If configured,
- statistical averages are indicated by a solid line, and thresholds by broken lines
- outliers are marked by a red asterisk. They are defined as data points outside the
threshold lines
- "aliens" (= data points outside the plot Y limits) are marked by a red arrow (↑ or ↓)
- you can download the data for each parameter set if the 'Data downloads' link shows up
|

