Plot
? |
Symb
? |
Source
* |
OPS?
** |
Average ? |
Thresholds ? |
N_
data |
QC1
parameter |
Data
downloads |
Remarks |
| method |
value |
unit |
method |
value |
| 1 |
• | QC1DB |
yes (1) |
MEDIAN |
517 |
ADU/sec |
VAL | 200,950 |
88 |
mean_flux |
this |
last_yr |
all
|
mean flux, chip 3, WREF=1090.4 |
| 2 |
• | QC1DB |
yes (1) |
MEDIAN |
258 |
ADU/sec |
VAL | 75,500 |
88 |
mean_flux |
this |
last_yr |
all
|
mean flux, chip 3, WREF=3218.6 |
| 3 |
• | QC1DB |
yes (1) |
MEDIAN |
395 |
ADU/sec |
VAL | 100,800 |
87 |
mean_flux |
this |
last_yr |
all
|
mean flux, chip 3, WREF=4092.9 |
| 4 |
• | QC1DB |
no |
MEDIAN |
0.0922 |
ADU |
VAL | 0.08,0.13 |
88 |
rms_master |
this |
last_yr |
all
|
rms, chip 3, WREF=1090.4 |
| 5 |
• | QC1DB |
no |
MEDIAN |
0.119 |
ADU |
VAL | 0.08,0.145 |
88 |
rms_master |
this |
last_yr |
all
|
rms, chip 3, WREF=3218.6 |
| 6 |
• | QC1DB |
no |
MEDIAN |
0.0788 |
ADU |
VAL | 0.05,0.1 |
87 |
rms_master |
this |
last_yr |
all
|
rms, chip 3, WREF=4092.9 |
| |
|
*Data sources: QC1DB: QC1 database; LOCAL: local text file | **OPS: OPSLOG data are included
|
Plot 1
scores:  8| 8|

| | data source: | crires_flat
(QC1 database) |
| dataset: | mean_flux | • |
| median: | 517 | ADU/sec |
| fixed thresholds: | 200...950 | ADU/sec |
| N_data plotted: | 88 |
| [click on plot for closeup] |
Plot 2
scores: 8|
| | data source: | crires_flat
(QC1 database) |
| dataset: | mean_flux | • |
| median: | 258 | ADU/sec |
| fixed thresholds: | 75...500 | ADU/sec |
| N_data plotted: | 88 |
| [click on plot for closeup] |
Plot 3
scores: 8|
| | data source: | crires_flat
(QC1 database) |
| dataset: | mean_flux | • |
| median: | 395 | ADU/sec |
| fixed thresholds: | 100...800 | ADU/sec |
| N_data plotted: | 87 |
| [click on plot for closeup] |
Plot 4
scores: not implemented
| | data source: | crires_flat
(QC1 database) |
| dataset: | rms_master | • |
| median: | 0.0922 | ADU |
| fixed thresholds: | 0.08...0.13 | ADU |
| N_data plotted: | 88 |
| [click on plot for closeup] |
Plot 5
scores: not implemented
| | data source: | crires_flat
(QC1 database) |
| dataset: | rms_master | • |
| median: | 0.119 | ADU |
| fixed thresholds: | 0.08...0.145 | ADU |
| N_data plotted: | 88 |
| [click on plot for closeup] |
Plot 6
scores: not implemented
| | data source: | crires_flat
(QC1 database) |
| dataset: | rms_master | • |
| median: | 0.0788 | ADU |
| fixed thresholds: | 0.05...0.1 | ADU |
| N_data plotted: | 87 |
| [click on plot for closeup] |
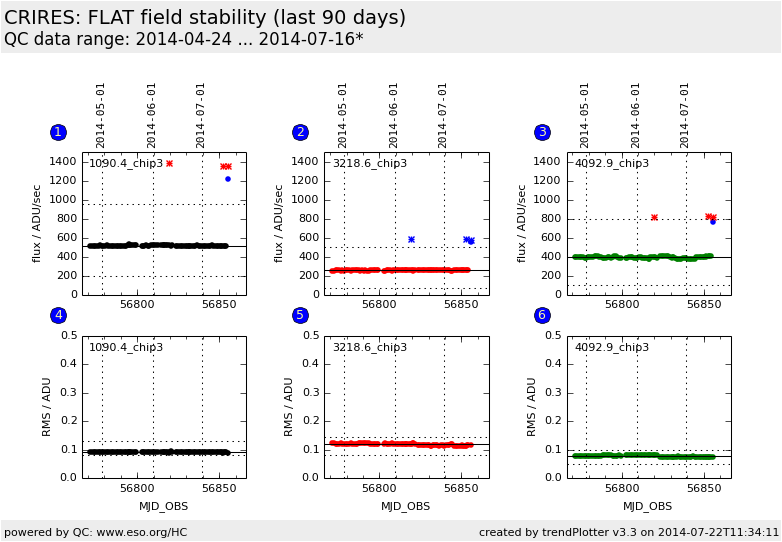
Trending plots monitoring the stability of flat fields.
Daily monitoring of flats is executed for three settings with reference
wavelengths 1090.4, 3218.6, and 4092.9 nm. Only data for chip 3 are
plotted here because the structure of the flats is unstable especially for
chips 1 and 4.
The first row shows the mean flux level of the flats. A sudden decrease of the
level below the typical variations could indicate a problem (e.g. with the
halogen lamp). The second row has the rms measured over the illuminated area.
A change would indicate a change in the overall structure of the flat.
As of March 2010, Paranal values are not plotted for rms because they deviate
strongly from QC Garching values (because of different recipe parameters).
General information
Click on any of the plots to see a close-up version.
If applicable, the latest values from Paranal ops logs are plotted as blue dots. More information about those values, including a download option, is available in the OPS column.
The latest date is indicated on top of the plot, data points belonging to that date are specially marked.
If configured,
- statistical averages are indicated by a solid line, and thresholds by broken lines
- outliers are marked by a red asterisk. They are defined as data points outside the
threshold lines
- "aliens" (= data points outside the plot Y limits) are marked by a red arrow (↑ or ↓)
- you can download the data for each parameter set if the 'Data downloads' link shows up
|

