Plot
? |
Symb
? |
Source
* |
OPS?
** |
Average ? |
Thresholds ? |
N_
data |
QC1
parameter |
Data
downloads |
Remarks |
| method |
value |
unit |
method |
value |
| 1 |
• | QC1DB |
yes (1) |
MEDIAN |
0.0473 |
e-/photon |
VAL | 0.01,0.12 |
17 |
med_through |
this |
last_yr |
all
|
throughput, WREF=1087.3, chip 3 |
| 2 |
• | QC1DB |
yes (1) |
MEDIAN |
0.0473 |
e-/photon |
VAL | 0.01,0.12 |
17 |
med_through |
this |
last_yr |
all
|
throughput, WREF=1504.8, chip 3 |
| 3 |
• | QC1DB |
yes (1) |
MEDIAN |
0.0652 |
e-/photon |
VAL | 0.01,0.12 |
15 |
med_through |
this |
last_yr |
all
|
throughput, WREF=2205.0, chip 3 |
| 4 |
• | QC1DB |
yes (1) |
MEDIAN |
0.0629 |
e-/photon |
VAL | 0.01,0.12 |
15 |
med_through |
this |
last_yr |
all
|
throughput, WREF=3611.0, chip 3 |
| 5 |
• | QC1DB |
yes (1) |
MEDIAN |
0.0877 |
e-/photon |
VAL | 0.01,0.12 |
16 |
med_through |
this |
last_yr |
all
|
throughput, WREF=5050.4, chip 3 |
| |
|
*Data sources: QC1DB: QC1 database; LOCAL: local text file | **OPS: OPSLOG data are included
|
Plot 1
scores:  3| 3|
| | data source: | crires_std
(QC1 database) |
| dataset: | med_through | • |
| median: | 0.0473 | e-/photon |
| fixed thresholds: | 0.01...0.12 | e-/photon |
| N_data plotted: | 17 |
| [click on plot for closeup] |
Plot 2
scores: 3|
| | data source: | crires_std
(QC1 database) |
| dataset: | med_through | • |
| median: | 0.0473 | e-/photon |
| fixed thresholds: | 0.01...0.12 | e-/photon |
| N_data plotted: | 17 |
| [click on plot for closeup] |
Plot 3
scores: 3|
| | data source: | crires_std
(QC1 database) |
| dataset: | med_through | • |
| median: | 0.0652 | e-/photon |
| fixed thresholds: | 0.01...0.12 | e-/photon |
| N_data plotted: | 15 |
| [click on plot for closeup] |
Plot 4
scores: 3|
| | data source: | crires_std
(QC1 database) |
| dataset: | med_through | • |
| median: | 0.0629 | e-/photon |
| fixed thresholds: | 0.01...0.12 | e-/photon |
| N_data plotted: | 15 |
| [click on plot for closeup] |
Plot 5
scores: 3|
| | data source: | crires_std
(QC1 database) |
| dataset: | med_through | • |
| median: | 0.0877 | e-/photon |
| fixed thresholds: | 0.01...0.12 | e-/photon |
| N_data plotted: | 16 |
| [click on plot for closeup] |
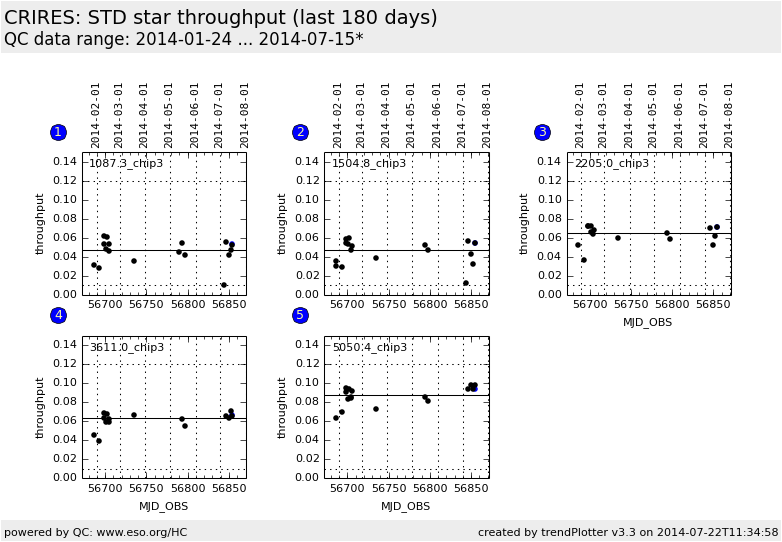
Trending plots for efficiency measurements (throughput in e-/photon in per
cent) with
spectro-phomtometric standard stars. Throughput is defined as the ratio of the
measured electrons (e-/sec/pixel) and the expected photon flux
(photons/sec/pixel).
Pipeline versions earlier than 2.1.x contained a bug for the efficiency
calculation. This has been fixed in April 2011. Older values in the QC1
database have been corrected. The conversion factor between old and new values
is about 2.4/100.
The overall instrument efficiency is measured with standard star observations
in 5 dedicated settings: 1087.3, 1504.8, 2205.0, 3611.0, and 5050.4 nm
reference wavelength. These plots show the median throughput for chip 3.
General information
Click on any of the plots to see a close-up version.
If applicable, the latest values from Paranal ops logs are plotted as blue dots. More information about those values, including a download option, is available in the OPS column.
The latest date is indicated on top of the plot, data points belonging to that date are specially marked.
If configured,
- statistical averages are indicated by a solid line, and thresholds by broken lines
- outliers are marked by a red asterisk. They are defined as data points outside the
threshold lines
- "aliens" (= data points outside the plot Y limits) are marked by a red arrow (↑ or ↓)
- you can download the data for each parameter set if the 'Data downloads' link shows up
|

