Plot
? |
Symb
? |
Source
* |
Average ? |
Thresholds ? |
N_
data |
QC1
parameter |
Data
downloads |
Remarks |
| method |
value |
unit |
method |
value |
| 1 |
• | QC1DB |
MEDIAN |
1.22e+03 |
nm |
VAL | 1219.779,1219.789 |
54 |
wave_centwl |
this |
last_yr |
all
|
CENTWL, wlen_id=J1228, CHIP1 |
| 2 |
• | QC1DB |
MEDIAN |
1.23e+03 |
nm |
VAL | 1228.436,1228.446 |
54 |
wave_centwl |
this |
last_yr |
all
|
CENTWL, wlen_id=J1228, CHIP2 |
| 3 |
• | QC1DB |
MEDIAN |
1.24e+03 |
nm |
VAL | 1236.663,1236.673 |
54 |
wave_centwl |
this |
last_yr |
all
|
CENTWL, wlen_id=J1228, CHIP3 |
| 4 |
• | QC1DB |
MEDIAN |
0.00403 |
nm_per_pix |
VAL | 0.00400,0.00406 |
54 |
wave_dispwl |
this |
last_yr |
all
|
DISPWL, wlen_id=J1228, CHIP1 |
| 5 |
• | QC1DB |
MEDIAN |
0.00384 |
nm_per_pix |
VAL | 0.00381,0.00387 |
54 |
wave_dispwl |
this |
last_yr |
all
|
DISPWL, wlen_id=J1228, CHIP2 |
| 6 |
• | QC1DB |
MEDIAN |
0.00365 |
nm_per_pix |
VAL | 0.00362,0.00368 |
54 |
wave_dispwl |
this |
last_yr |
all
|
DISPWL, wlen_id=J1228, CHIP3 |
| |
|
*Data sources: QC1DB: QC1 database; LOCAL: local data source
|
Plot 1
scores:  1| 1|
| | data source: | criresp_wave
(QC1 database) |
| dataset: | wave_centwl | • |
| median: | 1.22e+03 | nm |
| fixed thresholds: | 1219.779...1219.789 | nm |
| N_data plotted: | 54 |
| [click plot for closeup] |
Plot 2
scores: 1|
| | data source: | criresp_wave
(QC1 database) |
| dataset: | wave_centwl | • |
| median: | 1.23e+03 | nm |
| fixed thresholds: | 1228.436...1228.446 | nm |
| N_data plotted: | 54 |
| [click plot for closeup] |
Plot 3
scores: 1|
| | data source: | criresp_wave
(QC1 database) |
| dataset: | wave_centwl | • |
| median: | 1.24e+03 | nm |
| fixed thresholds: | 1236.663...1236.673 | nm |
| N_data plotted: | 54 |
| [click plot for closeup] |
Plot 4
scores: 1|
| | data source: | criresp_wave
(QC1 database) |
| dataset: | wave_dispwl | • |
| median: | 0.00403 | nm_per_pix |
| fixed thresholds: | 0.004...0.00406 | nm_per_pix |
| N_data plotted: | 54 |
| [click plot for closeup] |
Plot 5
scores: 1|
| | data source: | criresp_wave
(QC1 database) |
| dataset: | wave_dispwl | • |
| median: | 0.00384 | nm_per_pix |
| fixed thresholds: | 0.00381...0.00387 | nm_per_pix |
| N_data plotted: | 54 |
| [click plot for closeup] |
Plot 6
scores: 1|
| | data source: | criresp_wave
(QC1 database) |
| dataset: | wave_dispwl | • |
| median: | 0.00365 | nm_per_pix |
| fixed thresholds: | 0.00362...0.00368 | nm_per_pix |
| N_data plotted: | 54 |
| [click plot for closeup] |
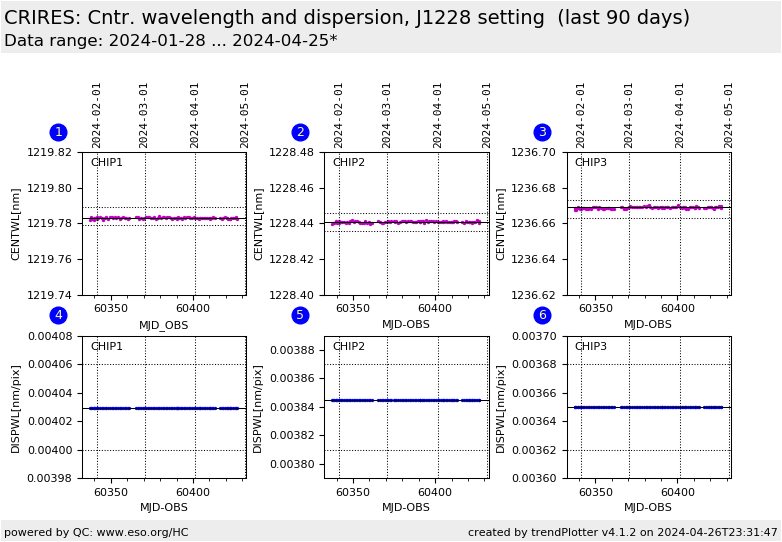
Trending plot for the WAVE central wavelength and spectral dispersion
in the CRIRES+ WAVE exposures for each of the detectors.
Only the DPR.TYPE=WAVE,FPET wavelength calibrations in INS.WLEN.ID=J1228,
INS.SLIT1.WIDTH=0.2 arcsec, taken with metrology (OCS.MTRLGY.ST = T)
are selected. The upper sub-plots correspond to the central wavelength
[nm] of each detector and the lower sub-plots show spectral dispersion
[nm/pixels] also for each detector.
General information
Click on any of the plots to see a close-up version.
The latest date is indicated on top of the plot.
If configured,
- data points belonging to the latest date are specially marked
- statistical averages are indicated by a solid line, and thresholds by broken lines
- outliers are marked by a red asterisk. They are defined as data points outside the
threshold lines
- "aliens" (= data points outside the plot Y limits) are marked by a red arrow (↑ or ↓)
- you can download the data for each parameter set if the 'Data downloads' link shows up
|
