Plot
? |
Symb
? |
Source
* |
Average ? |
Thresholds ? |
N_
data |
QC1
parameter |
Data
downloads |
Remarks |
| method |
value |
unit |
method |
value |
| 1 |
• | LOCAL |
none |
|
mm |
none | |
24669 |
PWV |
n/a |
PWV (in mm) of atmosphere above Paranal
a) Radiometer (LHATPRO) data |
| 1 |
□ | QC1DB |
none |
|
mm |
none | |
0 |
PWV |
this |
last_yr |
all
|
b) PWV from XSHOOTER telluric standard stars |
| 1 |
Δ | QC1DB |
none |
|
mm |
none | |
16 |
PWV |
this |
last_yr |
all
|
c) same, from UVES standard star equivalent widths |
| 2 |
• | LOCAL |
none |
|
mm |
none | |
24669 |
PWV |
n/a |
same as plot no. 1, zoom in to lowest 5 mm.
a) LHATPRO data |
| 2 |
□ | QC1DB |
none |
|
mm |
none | |
0 |
PWV |
this |
last_yr |
all
|
b) XSHOOTER |
| 2 |
Δ | QC1DB |
none |
|
mm |
none | |
16 |
PWV |
this |
last_yr |
all
|
c) UVES |
| |
|
*Data sources: QC1DB: QC1 database; LOCAL: local data source
|
| Plot 1 | | data source: | ambient_PWV
(QC1 database) |
dataset:
(numbers below apply to this dataset) | PWV | • |
| average: | none |
| thresholds: | none |
| N_data plotted: | 0 |
| [click plot for closeup] |
| Plot 2 | | data source: | ambient_PWV
(QC1 database) |
dataset:
(numbers below apply to this dataset) | PWV | • |
| average: | none |
| thresholds: | none |
| N_data plotted: | 0 |
| [click plot for closeup] |
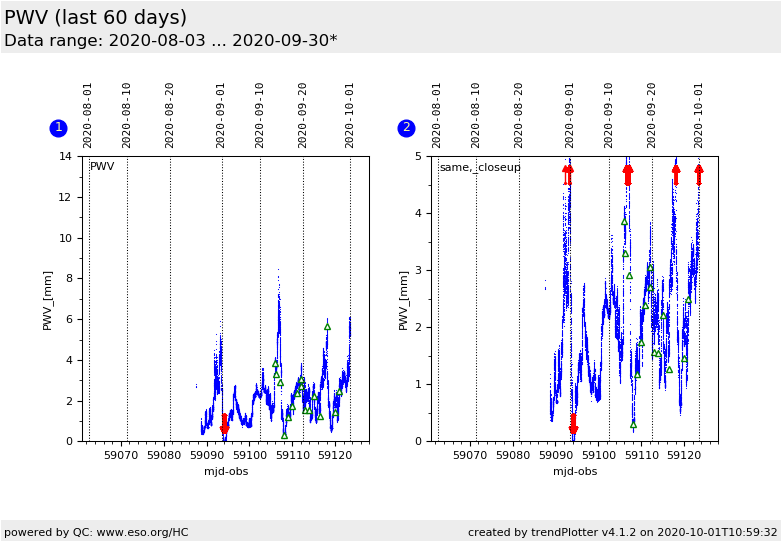
This plot displays PWV values for Paeranal, from radiometer (LHATPRO) data, and from UVES and X-SHOOTER standard stars. Since April 2015 the LHATPRO data are available in the ambient database, retrieved from there and displayed here.
Until 2013-12-12, there were also data
from CRIRES emission line fits.
Before the availability of the LHATPRO data (April 2015), the
standard star measurements of UVES and XSHOOTER have been used as an
approximation for the PWV values.
UVES has regular flux standard star measurements (usually at the begin of a
night). The telluric absorption lines in the pipeline product RED_STD_REDL of the 860 setting
are analyzed by a
routine written by Reinhard Hanuschik. It calculates the equivalent width of
the
telluric absorption lines, and transforms these values into PWV values using
a curve-of-growth. This method is called "WLAMBDA" in the
QC1 database.
XSHOOTER takes every few hours a telluric standard star, in all three arms. The products
from the VIS arm
are analyzed in a way similar to UVES. The X-Shooter PWV values are
also collected here.
Since 2015, the values from the radiometer LHATPRO on Paranal are written into
the headers of
VISIR science and STD star files, as keys TEL.AMBI.IWV.START and TEL.AMBI.IWV.END. They are extracted and also plotted here, to mark the epochs when VISIR actually used the prevailing PWV conditions.
All values are stored in a QC1 database table and plotted here. All routines
(parser, standard star processing, plotter) are called once per hour.
The plot is expected to be up-to-date within that time-scale, provided new input data are available.
Usually the pipeline
processing of the standard star data is also up-to-date within one hour. That
part has been implemented by Reinhard Hanuschik.
Plot #2 is a closeup of plot #1, emphasizing data values below
5 mm. Explore the PWV history under the link 'history'.
General information
Click on any of the plots to see a close-up version.
The latest date is indicated on top of the plot.
If configured,
- data points belonging to the latest date are specially marked
- statistical averages are indicated by a solid line, and thresholds by broken lines
- outliers are marked by a red asterisk. They are defined as data points outside the
threshold lines
- "aliens" (= data points outside the plot Y limits) are marked by a red arrow (↑ or ↓)
- you can download the data for each parameter set if the 'Data downloads' link shows up
|
