Plot
? |
Symb
? |
Source
* |
Average ? |
Thresholds ? |
N_
data |
QC1
parameter |
Data
downloads |
Remarks |
| method |
value |
unit |
method |
value |
| 1 |
• | LOCAL |
none |
|
mm |
none | |
8139 |
PWV |
n/a |
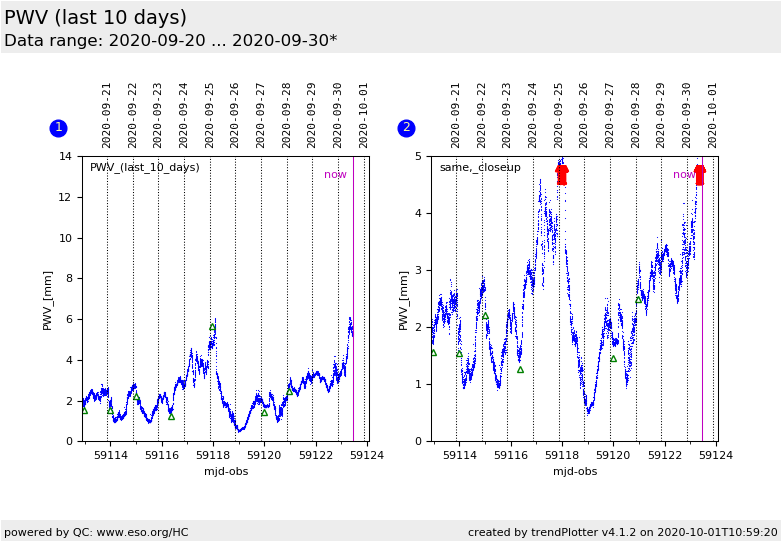
PWV (in mm) of atmosphere above Paranal; closeup of last 10 days.
a) Radiometer (LHATPRO) data |
| 1 |
□ | QC1DB |
none |
|
mm |
none | |
0 |
PWV |
this |
last_yr |
all
|
b) PWV from XSHOOTER telluric standard stars |
| 1 |
Δ | QC1DB |
none |
|
mm |
none | |
7 |
PWV |
this |
last_yr |
all
|
c) same, from UVES standard star equivalent widths |
| 2 |
• | LOCAL |
none |
|
mm |
none | |
8139 |
PWV |
n/a |
same as plot no. 1, zoom in to lowest 5 mm.
a) LHATPRO data |
| 2 |
□ | QC1DB |
none |
|
mm |
none | |
0 |
PWV |
this |
last_yr |
all
|
b) XSHOOTER |
| 2 |
Δ | QC1DB |
none |
|
mm |
none | |
7 |
PWV |
this |
last_yr |
all
|
c) UVES |
| |
|
*Data sources: QC1DB: QC1 database; LOCAL: local data source
|
| Plot 1 | | data source: | ambient_PWV
(QC1 database) |
dataset:
(numbers below apply to this dataset) | PWV | • |
| average: | none |
| thresholds: | none |
| N_data plotted: | 0 |
| [click plot for closeup] |
| Plot 2 | | data source: | ambient_PWV
(QC1 database) |
dataset:
(numbers below apply to this dataset) | PWV | • |
| average: | none |
| thresholds: | none |
| N_data plotted: | 0 |
| [click plot for closeup] |
This plot displays PWV values for Paranal, from radiometer (LHATPRO) data, and from UVES and X-SHOOTER standard stars. Since April 2015 the LHATPRO data are available in the ambient database, retrieved from there and displayed here.
Until
2013-12-12, there were also data
from CRIRES emission line fits.
It displays a closeup of the last 10
days. This format is intended to assist with operational planning based on the
PWV situation. Plot #2 is a closeup of plot #1, emphasizing data values below
5 mm.
Find more information about the underlying data in the "This plot" section of
the main plot ("PWV").
General information
Click on any of the plots to see a close-up version.
The latest date is indicated on top of the plot.
If configured,
- data points belonging to the latest date are specially marked
- statistical averages are indicated by a solid line, and thresholds by broken lines
- outliers are marked by a red asterisk. They are defined as data points outside the
threshold lines
- "aliens" (= data points outside the plot Y limits) are marked by a red arrow (↑ or ↓)
- you can download the data for each parameter set if the 'Data downloads' link shows up
|
