 mirror sites:
PL (internal
link) HQ
[?]
 mirror sites:
PL (internal
link) HQ
[?]
|
Health Check monitor |
| GIRAFFE trending system: HEALTH CHECK plot | ||||||||
| Last update: 2020-10-12T06:34:45 | last data from: | ||||||||
|
||||||||
|
||||||||
 |
||||||||

|
||||||||
|
||||||||
|
This plot
NOTE:
This set of plots has been maintained until 2020-3. It is NOT continued since then.
This is the trending plot for monitoring response and stability of the Giraffe fibres. Its purpose is to identify and monitor both fibre efficiency and stability. It helps identifying fibres with particularly low response, or unstable response. This may be useful e.g. for assigning sky fibres in the Medusa case. Input data are the Health Check fibre flats taken approximately every third day for the Medusa slits, and once a week for the IFu and Argus slits. The pipeline extracts the fibre signals and calculates relative efficiencies per fibre (normalized). These are averaged in chromatic (Y) direction and stored in a binary table, as a single transmission, or response, value per fibre. This table is appended as extension #1 to the product files with pro.catg=FF_EXTSPECTRA. Note that all of these files are robotic flats. Nasmyth flats are not included here because of their irregular acquisition, despite their better illumination pattern. The transmission numbers (columns FPS = fibre position index, and TRANSMISSION) are collected for all HC flats of a given 3 month period. Contrary to traditional QC parameters, they form a QC vector: one set of 135 (Medusa) or 317 (IFU, Argus) QC values per measurement. They are analyzed numerically to extract, per fibre, the following parameters:
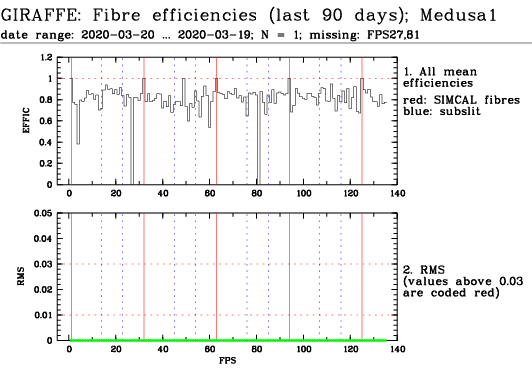
Each transmission vector is normalized to give the same average transmission (excluding broken fibres), so that subtle normalization differences hopefully cancel out and the rms values indeed reflect fibre instabilities only. The two plots on top display the following:
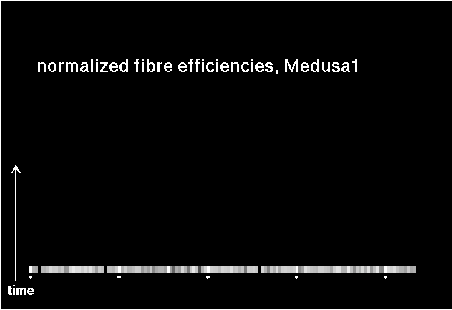
The 2D plot has ticks on the Y (time axis) to mark every fifth measurement, and on the X axis (fibre index) marking the SIMCAL fibres. The stability evaluation can be downloaded under "details per fibre". The list of input measurements (with dates, file names etc.) is available under "measurements". It also includes the currently missing (broken) fibres (if any). For quick reference, the currently missing fibres are also displayed on the top plot. |