Plot
? |
Symb
? |
Source
* |
Average ? |
Thresholds ? |
N_
data |
QC1
parameter |
Data
downloads |
Remarks |
| method |
value |
unit |
method |
value |
| 1 |
• | QC1DB |
MEAN |
0.0326 |
fraction |
VAL | 0.015,0.07 |
204 |
mean_effic |
all (full time range)
| Efficiency at central wavelength (Argus, HR grating): H447.1A |
| 2 |
• | QC1DB |
MEAN |
0.0421 |
fraction |
VAL | 0.03,0.10 |
208 |
mean_effic |
all (full time range)
| H651.5B |
| 3 |
• | QC1DB |
MEAN |
0.255 |
fraction |
VAL | 0.11,0.40 |
193 |
mean_effic |
all (full time range)
| H875.7 |
| 4 |
• | QC1DB |
MEAN |
0.0395 |
fraction |
VAL | 0.02,0.07 |
233 |
mean_effic |
all (full time range)
| Argus, LR grating: L427.2 |
| 5 |
• | QC1DB |
MEAN |
0.0511 |
fraction |
VAL | 0.03,0.09 |
229 |
mean_effic |
all (full time range)
| L543.1 |
| 6 |
• | QC1DB |
MEAN |
0.134 |
fraction |
VAL | 0.04,0.20 |
246 |
mean_effic |
all (full time range)
| L881.7 |
| |
|
*Data sources: QC1DB: QC1 database; LOCAL: local data source
|
Plot 1
scores:  1| 1|
| | data source: | giraffe_std
(QC1 database) |
| dataset: | mean_effic | • |
| mean: | 0.0326 | fraction |
| fixed thresholds: | 0.015...0.07 | fraction |
| N_data plotted: | 204 |
| [click plot for closeup] |
Plot 2
scores: 1|
| | data source: | giraffe_std
(QC1 database) |
| dataset: | mean_effic | • |
| mean: | 0.0421 | fraction |
| fixed thresholds: | 0.03...0.1 | fraction |
| N_data plotted: | 208 |
| [click plot for closeup] |
Plot 3
scores: 1|
| | data source: | giraffe_std
(QC1 database) |
| dataset: | mean_effic | • |
| mean: | 0.255 | fraction |
| fixed thresholds: | 0.11...0.4 | fraction |
| N_data plotted: | 193 |
| [click plot for closeup] |
Plot 4
scores: 1|
| | data source: | giraffe_std
(QC1 database) |
| dataset: | mean_effic | • |
| mean: | 0.0395 | fraction |
| fixed thresholds: | 0.02...0.07 | fraction |
| N_data plotted: | 233 |
| [click plot for closeup] |
Plot 5
scores: no current data
| | data source: | giraffe_std
(QC1 database) |
| dataset: | mean_effic | • |
| mean: | 0.0511 | fraction |
| fixed thresholds: | 0.03...0.09 | fraction |
| N_data plotted: | 229 |
| [click plot for closeup] |
Plot 6
scores: 1|
| | data source: | giraffe_std
(QC1 database) |
| dataset: | mean_effic | • |
| mean: | 0.134 | fraction |
| fixed thresholds: | 0.04...0.2 | fraction |
| N_data plotted: | 246 |
| [click plot for closeup] |
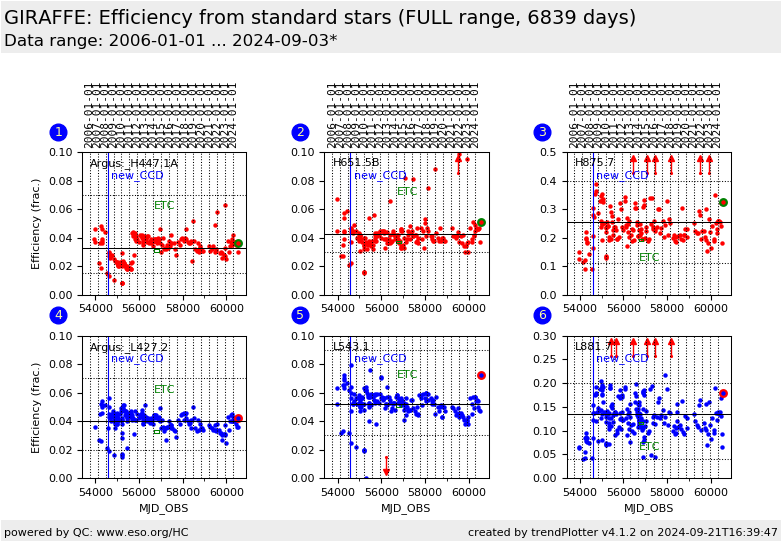
This is the Health Check plot to monitor the system efficiency of
GIRAFFE. It is based on measurements of a flux standard star with the Argus
IFU under photometric conditions. There are three settings taken with the
low-resolution grating (L427.2, L543.1, L881.7) and three more with the
high-resolution grating (H447.1A, H651.5B, H875.7). These data are taken
approximately every month. Find a chromatic plot of these values
here.
They are calibrated here with the robotic lamp flats. The flats are
used only for the localization solution (required for the extraction).
Contrary to the usual reduction, the extracted flat-field is not divided into
the standard star spectrum, in order not to corrupt the efficiency
calculation.
We display the QC1 parameter mean_effic which is the ratio of detected
photons and the incident photons. The signal from all fibres (excluding SKY and
SIMCAL) is combined and averaged.
For reference we also plot the current ETC values at the reference wavelength of
the setting. Check out the ETC for more.
General information
Click on any of the plots to see a close-up version.
The latest date is indicated on top of the plot.
If configured,
- data points belonging to the latest date are specially marked
- statistical averages are indicated by a solid line, and thresholds by broken lines
- outliers are marked by a red asterisk. They are defined as data points outside the
threshold lines
- "aliens" (= data points outside the plot Y limits) are marked by a red arrow (↑ or ↓)
- you can download the data for each parameter set if the 'Data downloads' link shows up
|
