Plot
? |
Symb
? |
Source
* |
Average ? |
Thresholds ? |
N_
data |
QC1
parameter |
Data
downloads |
Remarks |
| method |
value |
unit |
method |
value |
| 1 |
• | QC1DB |
none |
|
fraction |
none | |
37 |
mean_effic |
all (full time range)
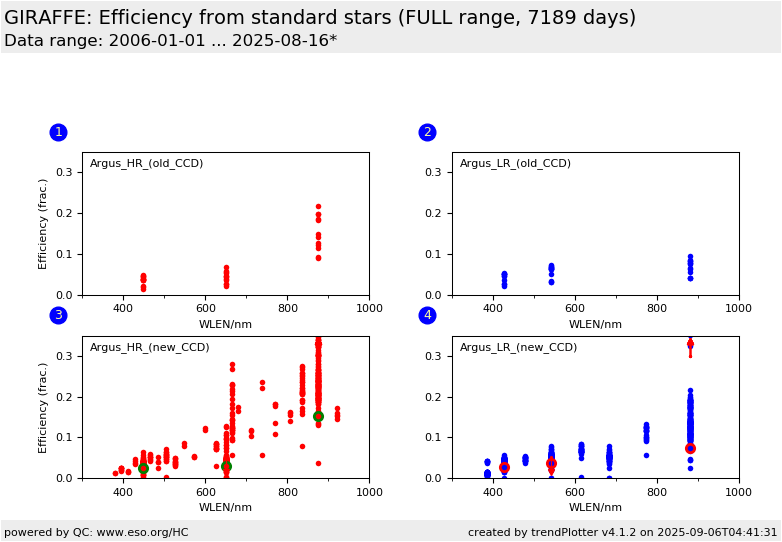
| HR efficiencies vs. wavelength (Argus, HR grating); old CCD |
| 2 |
• | QC1DB |
none |
|
fraction |
none | |
37 |
mean_effic |
all (full time range)
| LR efficiencies vs. wavelength (Argus, LR grating); old CCD |
| 3 |
• | QC1DB |
none |
|
fraction |
none | |
740 |
mean_effic |
all (full time range)
| HR efficiencies vs. wavelength (Argus, HR grating); new CCD |
| 4 |
• | QC1DB |
none |
|
fraction |
none | |
909 |
mean_effic |
all (full time range)
| LR efficiencies vs. wavelength (Argus, LR grating); new CCD |
| |
|
*Data sources: QC1DB: QC1 database; LOCAL: local data source
|
Plot 1
scores: not implemented
| | data source: | giraffe_std
(QC1 database) |
| dataset: | mean_effic | • |
| average: | none |
| thresholds: | none |
| N_data plotted: | 37 |
| [click plot for closeup] |
Plot 2
scores: not implemented
| | data source: | giraffe_std
(QC1 database) |
| dataset: | mean_effic | • |
| average: | none |
| thresholds: | none |
| N_data plotted: | 37 |
| [click plot for closeup] |
Plot 3
scores: not implemented
| | data source: | giraffe_std
(QC1 database) |
| dataset: | mean_effic | • |
| average: | none |
| thresholds: | none |
| N_data plotted: | 740 |
| [click plot for closeup] |
Plot 4
scores: not implemented
| | data source: | giraffe_std
(QC1 database) |
| dataset: | mean_effic | • |
| average: | none |
| thresholds: | none |
| N_data plotted: | 909 |
| [click plot for closeup] |
This is the Health Check plot to monitor the system efficiency of
GIRAFFE, with all data plotted on a chromatic scale (wavelength in nm).
Find more about the efficiency monitoring here.
We display the QC1 parameter mean_effic
(the ratio of detected
photons and incident photons) versus wavelength, for the HR and LR gratings
separately.
The top row has data for the old CCD (used until 2008-03-13); the bottom row
shows the new CCD (in operations since 2008-05-14).
General information
Click on any of the plots to see a close-up version.
The latest date is indicated on top of the plot.
If configured,
- data points belonging to the latest date are specially marked
- statistical averages are indicated by a solid line, and thresholds by broken lines
- outliers are marked by a red asterisk. They are defined as data points outside the
threshold lines
- "aliens" (= data points outside the plot Y limits) are marked by a red arrow (↑ or ↓)
- you can download the data for each parameter set if the 'Data downloads' link shows up
|
