Plot
? |
Symb
? |
Source
* |
Average ? |
Thresholds ? |
N_
data |
QC1
parameter |
Data
downloads |
Remarks |
| method |
value |
unit |
method |
value |
| 1 |
• | QC1DB |
none |
|
ADU |
none | |
345 |
mean_signal |
this |
last_yr |
all
|
mean image flat value in ADU, as function of exposure time (one year date range as indicated on the plot) (normal read mode) |
| 3 |
• | QC1DB |
none |
|
ADU/sec |
none | |
345 |
median_dit |
this |
last_yr |
all
|
values from plot no. 1, normalized by exptime (normal read mode) |
| 4 |
• | QC1DB |
none |
|
el/ADU |
none | |
345 |
conad |
this |
last_yr |
all
|
gain* values as function of mean flux in the image flats; only for new CCD)
(*note: the QC1 parameter is called conad by mistake, it should read gain) (normal read mode) |
| |
|
*Data sources: QC1DB: QC1 database; LOCAL: local data source
|
Plot 1
scores: not implemented
| | data source: | giraffe_ccd
(QC1 database) |
| dataset: | mean_signal | • |
| average: | none |
| thresholds: | none |
| N_data plotted: | 345 |
| [click plot for closeup] |
Plot 3
scores: not implemented
| | data source: | giraffe_ccd
(QC1 database) |
| dataset: | median_dit | • |
| average: | none |
| thresholds: | none |
| N_data plotted: | 345 |
| [click plot for closeup] |
Plot 4
scores: not implemented
| | data source: | giraffe_ccd
(QC1 database) |
| dataset: | conad | • |
| average: | none |
| thresholds: | none |
| N_data plotted: | 345 |
| [click plot for closeup] |
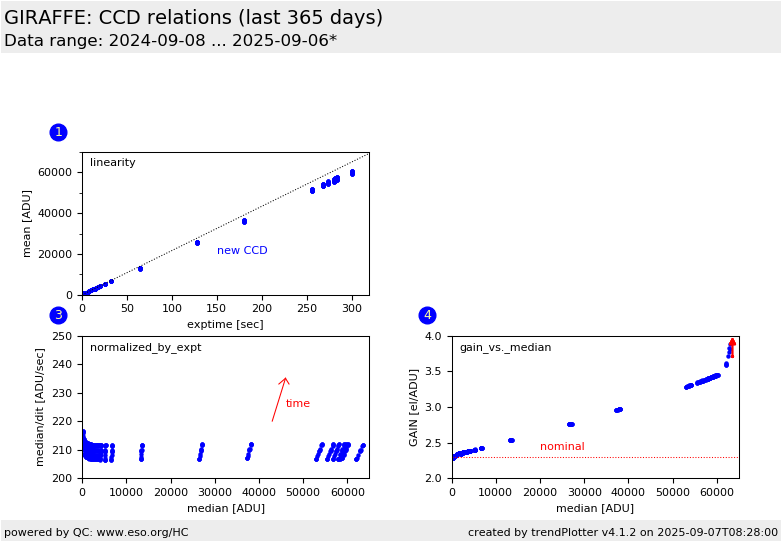
This report hosts correlation plots for the monitoring of the GIRAFFE
linearity and gain, derived from image flats. These data are taken
about monthly. Since 2008-07, they are acquired with the
common detector monitoring template and reduced with the corresponding common
recipe.
Note the CCD upgrade between 2008-03 and 2008-05. Plots #3 and 4 are available
for the new CCD only.
A sequence of image flats is exposed
between 0.5 and 220 secs. Their average exposure level is plotted against the
exposure time (box 1). The fitted function corresponds to
mean = 245*exptime for the old CCD, and 195*exptime for the new CCD. In box 3,
non-linear residuals are plotted vs. exposure time (new CCD only).
PLot 4 (for the new CCD only) shows the GAIN values plotted over exposure
time. The asymptotic value for texp -> 0 is the true GAIN. The value stored in
the file headers is indicated as "nominal".
Find the trending of non-linearity coefficient and gain here.
General information
Click on any of the plots to see a close-up version.
The latest date is indicated on top of the plot.
If configured,
- data points belonging to the latest date are specially marked
- statistical averages are indicated by a solid line, and thresholds by broken lines
- outliers are marked by a red asterisk. They are defined as data points outside the
threshold lines
- "aliens" (= data points outside the plot Y limits) are marked by a red arrow (↑ or ↓)
- you can download the data for each parameter set if the 'Data downloads' link shows up
|
