Plot
? |
Symb
? |
Source
* |
Average ? |
Thresholds ? |
N_
data |
QC1
parameter |
Data
downloads |
Remarks |
| method |
value |
unit |
method |
value |
| 1 |
• | QC1DB |
MEDIAN |
148 |
counts/sec |
VAL | 80,290 |
36 |
flux |
this |
last_yr |
all
|
flux of (robotic) FF lamp, L543.1 setting; Medusa1 |
| 2 |
+ | QC1DB |
MEDIAN |
148 |
counts/sec |
VAL | 80,290 |
28 |
flux |
this |
last_yr |
all
|
as plot 1, Medusa2 |
| 3 |
∗ | QC1DB |
MEDIAN |
74 |
counts/sec |
VAL | 18,170 |
12 |
flux |
this |
last_yr |
all
|
as plot 1, IFU1 |
| 4 |
▲ | QC1DB |
MEDIAN |
77.5 |
counts/sec |
VAL | 18,170 |
14 |
flux |
this |
last_yr |
all
|
as plot 1, IFU2 |
| 5 |
• | QC1DB |
MEDIAN |
38.5 |
counts/sec |
VAL | 10,90 |
15 |
flux |
this |
last_yr |
all
|
as plot1 , Argus |
| 6 |
• | QC1DB |
none |
|
counts/sec |
none | |
36 |
flux |
this |
last_yr |
all
|
as plot 1, combining all L543.1 flats; Medusa1 |
| 6 |
+ | QC1DB |
none |
|
counts/sec |
none | |
28 |
flux |
this |
last_yr |
all
|
Medusa2 |
| 6 |
∗ | QC1DB |
none |
|
counts/sec |
none | |
12 |
flux |
this |
last_yr |
all
|
IFU1 |
| 6 |
▲ | QC1DB |
none |
|
counts/sec |
none | |
14 |
flux |
this |
last_yr |
all
|
IFU2 |
| 6 |
• | QC1DB |
none |
|
counts/sec |
none | |
15 |
flux |
this |
last_yr |
all
|
Argus |
| |
|
*Data sources: QC1DB: QC1 database; LOCAL: local data source
|
Plot 1
scores:  3| 3|
| | data source: | giraffe_flat
(QC1 database) |
| dataset: | flux | • |
| median: | 148 | counts/sec |
| fixed thresholds: | 80...290 | counts/sec |
| N_data plotted: | 36 |
| [click plot for closeup] |
Plot 2
scores: 1|
| | data source: | giraffe_flat
(QC1 database) |
| dataset: | flux | + |
| median: | 148 | counts/sec |
| fixed thresholds: | 80...290 | counts/sec |
| N_data plotted: | 28 |
| [click plot for closeup] |
Plot 3
scores: 1|
| | data source: | giraffe_flat
(QC1 database) |
| dataset: | flux | ∗ |
| median: | 74 | counts/sec |
| fixed thresholds: | 18...170 | counts/sec |
| N_data plotted: | 12 |
| [click plot for closeup] |
Plot 4
scores: 1|
| | data source: | giraffe_flat
(QC1 database) |
| dataset: | flux | ▲ |
| median: | 77.5 | counts/sec |
| fixed thresholds: | 18...170 | counts/sec |
| N_data plotted: | 14 |
| [click plot for closeup] |
Plot 5
scores: 3|
| | data source: | giraffe_flat
(QC1 database) |
| dataset: | flux | • |
| median: | 38.5 | counts/sec |
| fixed thresholds: | 10...90 | counts/sec |
| N_data plotted: | 15 |
| [click plot for closeup] |
Plot 6
scores: not implemented
| | data source: | giraffe_flat
(QC1 database) |
dataset:
(numbers below apply to this dataset) | flux | • |
| average: | none |
| thresholds: | none |
| N_data plotted: | 36 |
| [click plot for closeup] |
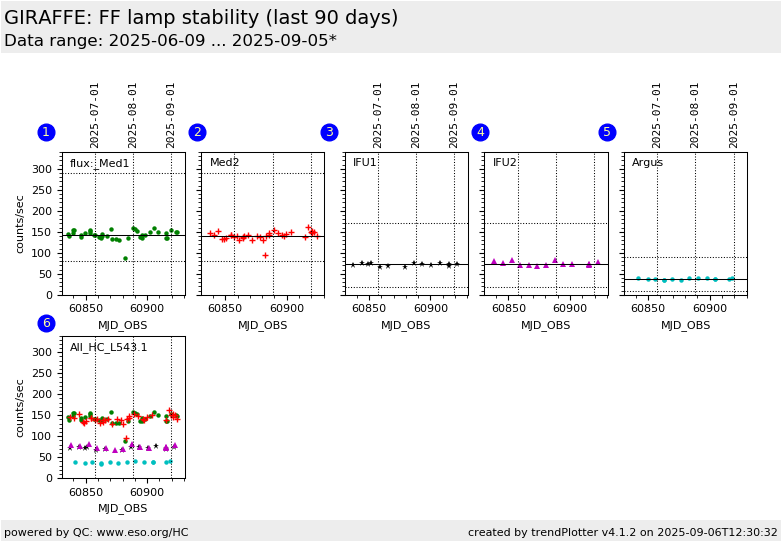
This is the Health Check plot for the stability of the GIRAFFE flat field calibration
lamps. The plot is based on ROBOTIC flats (flattype=ROB) taken several times a week.
All 5 fibre systems (on two plates) are illuminated by the same flat lamp.
Since June 2006, the HC flats are measured for all five slit systems.
Before that date, they were taken for Medusa1 and Medusa2 only.
The average flux is obtained by dividing the average signal in the first raw
file by the EXPTIME.
Any effect showing up in only one fibre system is likely to be
caused by that fibre system. Effects related to the lamp should be visible
in any fibre system in the same way.
Find more tutorial information here.
General information
Click on any of the plots to see a close-up version.
The latest date is indicated on top of the plot.
If configured,
- data points belonging to the latest date are specially marked
- statistical averages are indicated by a solid line, and thresholds by broken lines
- outliers are marked by a red asterisk. They are defined as data points outside the
threshold lines
- "aliens" (= data points outside the plot Y limits) are marked by a red arrow (↑ or ↓)
- you can download the data for each parameter set if the 'Data downloads' link shows up
|
