Plot
? |
Symb
? |
Source
* |
Average ? |
Thresholds ? |
N_
data |
QC1
parameter |
Data
downloads |
Remarks |
| method |
value |
unit |
method |
value |
| 1 |
• | QC1DB |
none |
|
counts |
VAL | 2000,19000 |
25 |
mean_raw |
this |
last_yr |
all
|
Flat field level per wavelength, all Medusa1 HR settings, 'Normal' read mode only |
| 2 |
+ | QC1DB |
none |
|
counts |
VAL | 2000,19000 |
33 |
mean_raw |
this |
last_yr |
all
|
as plot 1, Medusa2 HR |
| 3 |
∗ | QC1DB |
none |
|
counts |
VAL | 2000,24000 |
2 |
mean_raw |
this |
last_yr |
all
|
as plot 1, IFU1 HR |
| 4 |
▲ | QC1DB |
none |
|
counts |
VAL | 2000,24000 |
2 |
mean_raw |
this |
last_yr |
all
|
as plot 1, IFU2 HR |
| 5 |
• | QC1DB |
none |
|
counts |
VAL | 2000,24000 |
13 |
mean_raw |
this |
last_yr |
all
|
as plot 1, Argus HR |
|
| 6 |
• | QC1DB |
none |
|
counts |
VAL | 2000,19000 |
36 |
mean_raw |
this |
last_yr |
all
|
same, all Medusa1 LR settings |
| 7 |
+ | QC1DB |
none |
|
counts |
VAL | 2000,19000 |
30 |
mean_raw |
this |
last_yr |
all
|
as plot 6, Medusa2 LR |
| 8 |
∗ | QC1DB |
none |
|
counts |
VAL | 2000,24000 |
13 |
mean_raw |
this |
last_yr |
all
|
as plot 6, IFU1 LR |
| 9 |
▲ | QC1DB |
none |
|
counts |
VAL | 2000,24000 |
14 |
mean_raw |
this |
last_yr |
all
|
as plot 6, IFU2 LR |
| 10 |
• | QC1DB |
none |
|
counts |
VAL | 2000,24000 |
21 |
mean_raw |
this |
last_yr |
all
|
as plot 6, Argus LR |
| |
|
*Data sources: QC1DB: QC1 database; LOCAL: local data source
|
Plot 1
scores: not implemented
| | data source: | giraffe_flat
(QC1 database) |
| dataset: | mean_raw | • |
| average: | none |
| fixed thresholds: | 2000...19000 | counts |
| N_data plotted: | 25 |
| [click plot for closeup] |
Plot 2
scores: not implemented
| | data source: | giraffe_flat
(QC1 database) |
| dataset: | mean_raw | + |
| average: | none |
| fixed thresholds: | 2000...19000 | counts |
| N_data plotted: | 33 |
| [click plot for closeup] |
Plot 3
scores: not implemented
| | data source: | giraffe_flat
(QC1 database) |
| dataset: | mean_raw | ∗ |
| average: | none |
| fixed thresholds: | 2000...24000 | counts |
| N_data plotted: | 2 |
| [click plot for closeup] |
Plot 4
scores: not implemented
| | data source: | giraffe_flat
(QC1 database) |
| dataset: | mean_raw | ▲ |
| average: | none |
| fixed thresholds: | 2000...24000 | counts |
| N_data plotted: | 2 |
| [click plot for closeup] |
Plot 5
scores: not implemented
| | data source: | giraffe_flat
(QC1 database) |
| dataset: | mean_raw | • |
| average: | none |
| fixed thresholds: | 2000...24000 | counts |
| N_data plotted: | 13 |
| [click plot for closeup] |
Plot 6
scores: not implemented
| | data source: | giraffe_flat
(QC1 database) |
| dataset: | mean_raw | • |
| average: | none |
| fixed thresholds: | 2000...19000 | counts |
| N_data plotted: | 36 |
| [click plot for closeup] |
Plot 7
scores: not implemented
| | data source: | giraffe_flat
(QC1 database) |
| dataset: | mean_raw | + |
| average: | none |
| fixed thresholds: | 2000...19000 | counts |
| N_data plotted: | 30 |
| [click plot for closeup] |
Plot 8
scores: not implemented
| | data source: | giraffe_flat
(QC1 database) |
| dataset: | mean_raw | ∗ |
| average: | none |
| fixed thresholds: | 2000...24000 | counts |
| N_data plotted: | 13 |
| [click plot for closeup] |
Plot 9
scores: not implemented
| | data source: | giraffe_flat
(QC1 database) |
| dataset: | mean_raw | ▲ |
| average: | none |
| fixed thresholds: | 2000...24000 | counts |
| N_data plotted: | 14 |
| [click plot for closeup] |
Plot 10
scores: not implemented
| | data source: | giraffe_flat
(QC1 database) |
| dataset: | mean_raw | • |
| average: | none |
| fixed thresholds: | 2000...24000 | counts |
| N_data plotted: | 21 |
| [click plot for closeup] |
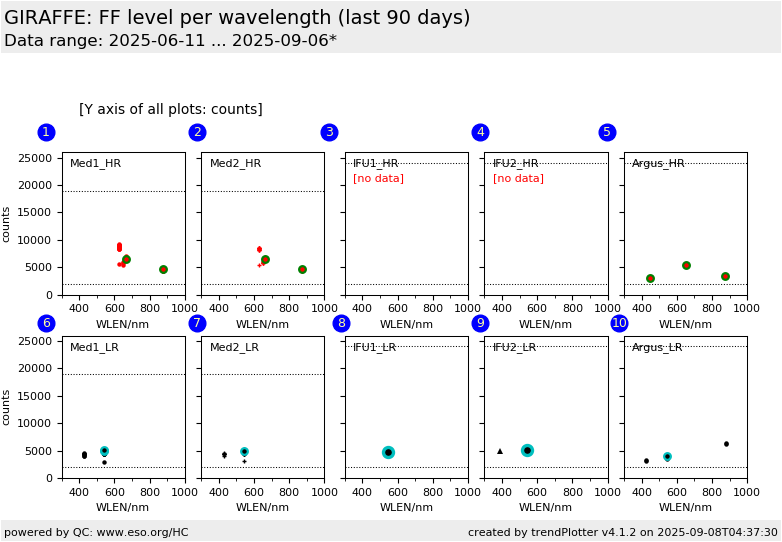
This is the Health Check plot for the signal level in the GIRAFFE
flat field calibration data. We display the QC1 parameter mean_raw
(QC.OUT1.MEAN.RAW) of the first input raw frame. This plot monitors all
setups for the 'normal' read mode.
Check the "all_FLATs" plot for the same data set, plotted over
time.
The purpose of this plot is to guarantee that
all flat field calibration data have an exposure level which is good enough
to record the pixel-to-pixel gain variations.
The data are checked against upper and lower limits. The lower limit is the
most important one. From the CCD trending plot
(no. 1), it follows that a single flat must have a minimum flux level of
roughly 20.000 ADU at the fibre peak, in order to be dominated by the
pixel-to-pixel gain pattern rather than by photon noise. From the topology of
the flat frame
signal, it follows a corresponding mean_raw value of about 7000 ADU. Assuming
three input flats creating a single master fiber flat, we derive an
approximate lower limit of 2000 ADU. In the same way, the IFU flats require
about 3000 ADUs on average.
The upper limit is derived from the saturation limit.
Note: All blue setups (below about 400 nm) have a mean raw flux which is rather low, often
below the thresholds.
This is usually not an issue since it is compensated by an increased number of raw files.
General information
Click on any of the plots to see a close-up version.
The latest date is indicated on top of the plot.
If configured,
- data points belonging to the latest date are specially marked
- statistical averages are indicated by a solid line, and thresholds by broken lines
- outliers are marked by a red asterisk. They are defined as data points outside the
threshold lines
- "aliens" (= data points outside the plot Y limits) are marked by a red arrow (↑ or ↓)
- you can download the data for each parameter set if the 'Data downloads' link shows up
|
