Plot
? |
Symb
? |
Source
* |
OPS?
** |
Average ? |
Thresholds ? |
N_
data |
QC1
parameter |
Data
downloads |
Remarks |
| method |
value |
unit |
method |
value |
| 1 |
o | QC1DB |
no |
none |
|
ratio |
none | |
20 |
qc_eff_ul |
all (full time range)
| in pixel [256:768] = UL quadrant center |
| 2 |
o | QC1DB |
no |
none |
|
ratio |
none | |
20 |
qc_eff_ur |
all (full time range)
| in pixel [768:768] = UR quadrant center |
| 3 |
o | QC1DB |
no |
none |
|
ratio |
none | |
20 |
qc_eff_cc |
all (full time range)
| in pixel [512:512] = detector center |
| 4 |
o | QC1DB |
no |
none |
|
ratio |
none | |
20 |
qc_eff_ll |
all (full time range)
| in pixel [256:256] = LL quadrant center |
| 5 |
o | QC1DB |
no |
none |
|
ratio |
none | |
20 |
qc_eff_lr |
all (full time range)
| in pixel [768:256] = LR quadrant center |
| |
|
*Data sources: QC1DB: QC1 database; LOCAL: local text file | **OPS: OPSLOG data are included
|
Plot 1
scores: not implemented
| | data source: | isaac_illu
(QC1 database) |
| dataset: | qc_eff_ul | o |
| average: | none |
| thresholds: | none |
| N_data plotted: | 20 |
| [click on plot for closeup] |
Plot 2
scores: not implemented
| | data source: | isaac_illu
(QC1 database) |
| dataset: | qc_eff_ur | o |
| average: | none |
| thresholds: | none |
| N_data plotted: | 20 |
| [click on plot for closeup] |
Plot 3
scores: not implemented
| | data source: | isaac_illu
(QC1 database) |
| dataset: | qc_eff_cc | o |
| average: | none |
| thresholds: | none |
| N_data plotted: | 20 |
| [click on plot for closeup] |
Plot 4
scores: not implemented
| | data source: | isaac_illu
(QC1 database) |
| dataset: | qc_eff_ll | o |
| average: | none |
| thresholds: | none |
| N_data plotted: | 20 |
| [click on plot for closeup] |
Plot 5
scores: not implemented
| | data source: | isaac_illu
(QC1 database) |
| dataset: | qc_eff_lr | o |
| average: | none |
| thresholds: | none |
| N_data plotted: | 20 |
| [click on plot for closeup] |
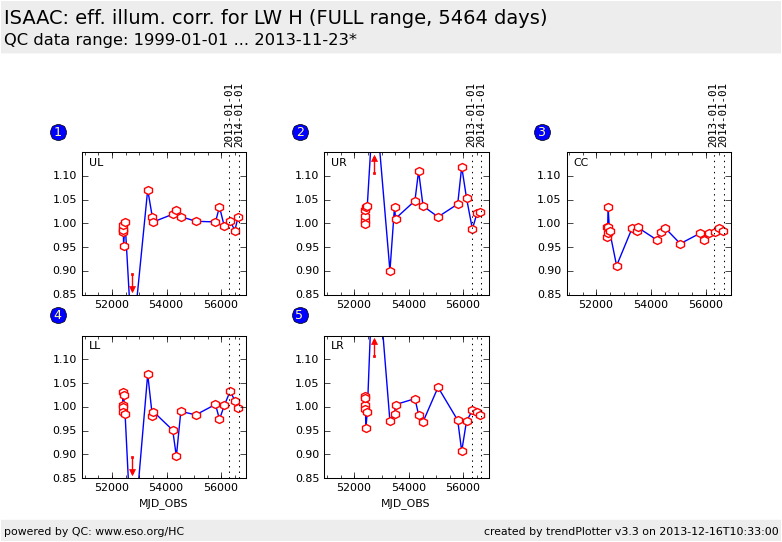
This is the trending plot for the ISAAC illumination correction calibrations of the LW-arm,
H filter
The photmetric standard star measured on 17 positions in a regular
grid in the FOV is fit by a polymial. The polynomial values for selected
pixel are given.
These plots describe the measured and fit illumination applied
to:
Fig. 1. center of UL quadrant: Pixel [256,768]
Fig. 2. center of UR quadrant: Pixel [768,768]
Fig. 3. center of detector CC: Pixel [513,513]
Fig. 4. center of LL quadrant: Pixel [256,256]
Fig. 5. center of MR quadrant: Pixel [768,768]
Find more information about ISAAC QC parameters derived from illumination
correction frames
here.
General information
Click on any of the plots to see a close-up version.
The latest date is indicated on top of the plot, data points belonging to that date are specially marked.
If configured,
- statistical averages are indicated by a solid line, and thresholds by broken lines
- outliers are marked by a red asterisk. They are defined as data points outside the
threshold lines
- "aliens" (= data points outside the plot Y limits) are marked by a red arrow (↑ or ↓)
- you can download the data for each parameter set if the 'Data downloads' link shows up
|

