Plot
? |
Symb
? |
Source
* |
OPS?
** |
Average ? |
Thresholds ? |
N_
data |
QC1
parameter |
Data
downloads |
Remarks |
| method |
value |
unit |
method |
value |
| 1 |
• | QC1DB |
no |
none |
|
ADU |
none | |
24 |
qc_distLR1 |
all (full time range)
| optical Y-distortion coefficient for SW, LR |
| 2 |
• | QC1DB |
no |
none |
|
ADU |
none | |
24 |
qc_distLRX |
all (full time range)
| optical Y-distortion coefficient for SW, LR |
| 3 |
• | QC1DB |
no |
none |
|
ADU |
none | |
24 |
qc_distLRY |
all (full time range)
| optical Y-distortion coefficient for SW, LR |
| 4 |
• | QC1DB |
no |
none |
|
ADU |
none | |
24 |
qc_distLRXX |
all (full time range)
| optical Y-distortion coefficient for SW, LR |
| 5 |
• | QC1DB |
no |
none |
|
ADU |
none | |
24 |
qc_distLRYY |
all (full time range)
| optical Y-distortion coefficient for SW, LR |
| 6 |
• | QC1DB |
no |
none |
|
ADU |
none | |
24 |
qc_distLRXY |
all (full time range)
| optical Y-distortion coefficient for SW, LR |
| |
|
*Data sources: QC1DB: QC1 database; LOCAL: local text file | **OPS: OPSLOG data are included
|
Plot 1
scores: not implemented
| | data source: | isaac_strace
(QC1 database) |
| dataset: | qc_distLR1 | • |
| average: | none |
| thresholds: | none |
| N_data plotted: | 24 |
| [click on plot for closeup] |
Plot 2
scores: not implemented
| | data source: | isaac_strace
(QC1 database) |
| dataset: | qc_distLRX | • |
| average: | none |
| thresholds: | none |
| N_data plotted: | 24 |
| [click on plot for closeup] |
Plot 3
scores: not implemented
| | data source: | isaac_strace
(QC1 database) |
| dataset: | qc_distLRY | • |
| average: | none |
| thresholds: | none |
| N_data plotted: | 24 |
| [click on plot for closeup] |
Plot 4
scores: not implemented
| | data source: | isaac_strace
(QC1 database) |
| dataset: | qc_distLRXX | • |
| average: | none |
| thresholds: | none |
| N_data plotted: | 24 |
| [click on plot for closeup] |
Plot 5
scores: not implemented
| | data source: | isaac_strace
(QC1 database) |
| dataset: | qc_distLRYY | • |
| average: | none |
| thresholds: | none |
| N_data plotted: | 24 |
| [click on plot for closeup] |
Plot 6
scores: not implemented
| | data source: | isaac_strace
(QC1 database) |
| dataset: | qc_distLRXY | • |
| average: | none |
| thresholds: | none |
| N_data plotted: | 24 |
| [click on plot for closeup] |
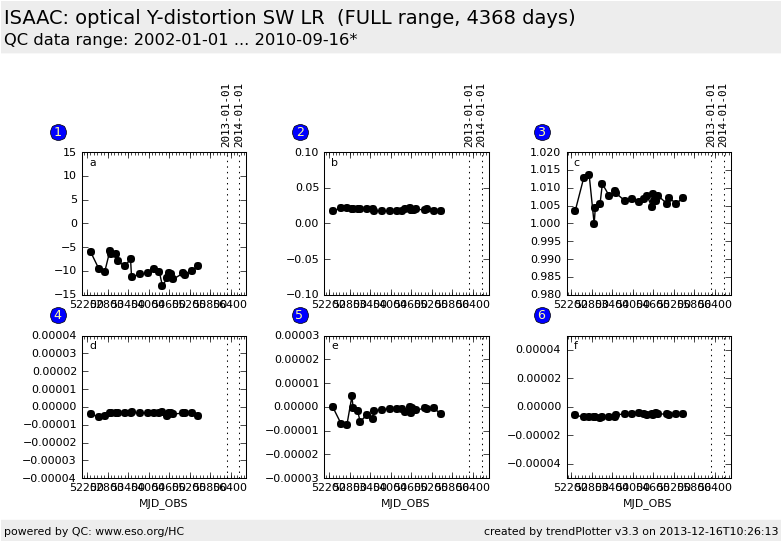
This is the trending plot for the ISAAC startrace calibrations of the SW-arm, LR-grating
Optical distortion coefficients for setup SW, LR
as derived from the startrace recipe to describe the optical distortion
in y-direction (perpenticular to the dispersion direction).
Startrace calibrations are acquired once per year.
The value Delta Y is given by :
Delta Y = a + b * x + c * y + d * x*x + e * y*y + f * x*y - y
These plots describe:
Fig. 1. coefficient a, the offset in y
Fig. 2. coefficient b, linear term for x
Fig. 3. coefficient c, linear term for y
Fig. 4. coefficient d, x square term
Fig. 5. coefficient e, y square term
Fig. 6. coefficient f, mixed higher order term
Find more information about ISAAC QC parameters derived from arc lamp frames
here.
General information
Click on any of the plots to see a close-up version.
The latest date is indicated on top of the plot, data points belonging to that date are specially marked.
If configured,
- statistical averages are indicated by a solid line, and thresholds by broken lines
- outliers are marked by a red asterisk. They are defined as data points outside the
threshold lines
- "aliens" (= data points outside the plot Y limits) are marked by a red arrow (↑ or ↓)
- you can download the data for each parameter set if the 'Data downloads' link shows up
|

