Plot
? |
Symb
? |
Source
* |
OPS?
** |
Average ? |
Thresholds ? |
N_
data |
QC1
parameter |
Data
downloads |
Remarks |
| method |
value |
unit |
method |
value |
| 1 |
• | QC1DB |
yes (2) |
none |
|
ADU |
VAL | 0.99,1.01 |
21 |
oc_UL_mean |
this |
last_yr |
all
|
OddEvenCol Effect Mean value |
| 2 |
• | QC1DB |
yes (2) |
none |
|
ADU |
VAL | 0.99,1.01 |
21 |
oc_UR_mean |
this |
last_yr |
all
|
OddEvenCol Effect Mean value |
| 3 |
• | QC1DB |
yes (2) |
none |
|
ADU |
VAL | 0.,0.0025 |
21 |
oc_UL_std |
this |
last_yr |
all
|
OddEvenCol Effect Stdev value |
| 4 |
• | QC1DB |
yes (2) |
none |
|
ADU |
VAL | 0.,0.0025 |
21 |
oc_UR_std |
this |
last_yr |
all
|
OddEvenCol Effect Stdev value |
| 5 |
• | QC1DB |
yes (2) |
none |
|
ADU |
VAL | 0.99,1.01 |
21 |
oc_LL_mean |
this |
last_yr |
all
|
OddEvenCol Effect Mean value |
| 6 |
• | QC1DB |
yes (2) |
none |
|
ADU |
VAL | 0.99,1.01 |
21 |
oc_LR_mean |
this |
last_yr |
all
|
OddEvenCol Effect Mean value |
| 7 |
• | QC1DB |
yes (2) |
none |
|
ADU |
VAL | 0.,0.0025 |
21 |
oc_LL_std |
this |
last_yr |
all
|
OddEvenCol Effect Stdev value |
| 8 |
• | QC1DB |
yes (2) |
none |
|
ADU |
VAL | 0.,0.0025 |
21 |
oc_LR_std |
this |
last_yr |
all
|
OddEvenCol Effect Stdev value |
| |
|
*Data sources: QC1DB: QC1 database; LOCAL: local text file | **OPS: OPSLOG data are included
|
Plot 1
scores:  2| 2|
| | data source: | isaac_twflat_oe
(QC1 database) |
| dataset: | oc_UL_mean | • |
| average: | none |
| fixed thresholds: | 0.99...1.01 | ADU |
| N_data plotted: | 21 |
| [click on plot for closeup] |
Plot 2
scores: 2|
| | data source: | isaac_twflat_oe
(QC1 database) |
| dataset: | oc_UR_mean | • |
| average: | none |
| fixed thresholds: | 0.99...1.01 | ADU |
| N_data plotted: | 21 |
| [click on plot for closeup] |
Plot 5
scores: 2|
| | data source: | isaac_twflat_oe
(QC1 database) |
| dataset: | oc_LL_mean | • |
| average: | none |
| fixed thresholds: | 0.99...1.01 | ADU |
| N_data plotted: | 21 |
| [click on plot for closeup] |
Plot 6
scores: 2|
| | data source: | isaac_twflat_oe
(QC1 database) |
| dataset: | oc_LR_mean | • |
| average: | none |
| fixed thresholds: | 0.99...1.01 | ADU |
| N_data plotted: | 21 |
| [click on plot for closeup] |
Plot 3
scores: 2|
| | data source: | isaac_twflat_oe
(QC1 database) |
| dataset: | oc_UL_std | • |
| average: | none |
| fixed thresholds: | 0.0...0.0025 | ADU |
| N_data plotted: | 21 |
| [click on plot for closeup] |
Plot 4
scores: 2|

| | data source: | isaac_twflat_oe
(QC1 database) |
| dataset: | oc_UR_std | • |
| average: | none |
| fixed thresholds: | 0.0...0.0025 | ADU |
| N_data plotted: | 21 |
| [click on plot for closeup] |
Plot 7
scores: 2|
| | data source: | isaac_twflat_oe
(QC1 database) |
| dataset: | oc_LL_std | • |
| average: | none |
| fixed thresholds: | 0.0...0.0025 | ADU |
| N_data plotted: | 21 |
| [click on plot for closeup] |
Plot 8
scores: 2|
| | data source: | isaac_twflat_oe
(QC1 database) |
| dataset: | oc_LR_std | • |
| average: | none |
| fixed thresholds: | 0.0...0.0025 | ADU |
| N_data plotted: | 21 |
| [click on plot for closeup] |
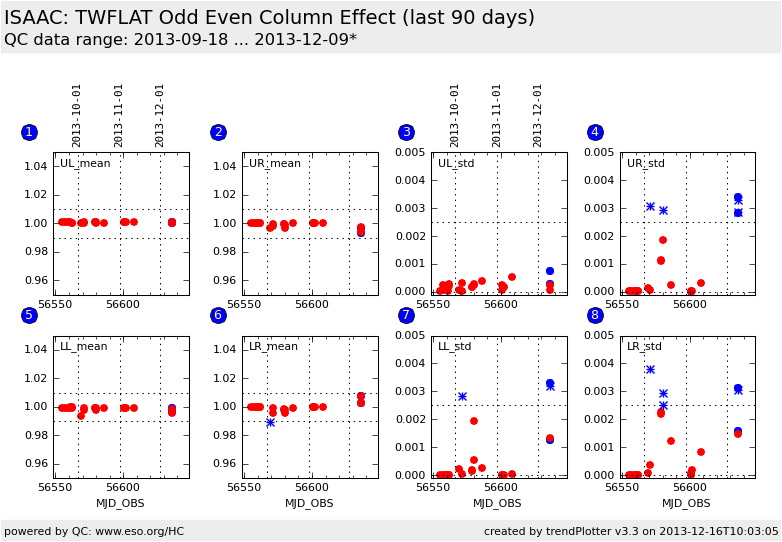
This is the trending plot for the ISAAC twilight flat QC parameters of the SW-arm
These plots describe:
The so-called odd-even-column-effect (OE). The effect is monitored via two
different QC parameters per filter and per quadrant. The definition of the
parameters is explained on the
QC twflat page. There had been
only a very few events during the Hawaii detector life time when the QC1 parameters
reached and exceeded the per-cent level.
Fig.1. Odd columns mean parameter upper left quadrant of the detector.
Fig.2. Odd columns mean parameter upper right quadrant of the detector.
Fig.5. Odd columns mean parameter lower left quadrant of the detector.
Fig.6. Odd columns mean parameter lower right quadrant of the detector.
Fig.3. Odd columns stdev parameter upper left quadrant of the detector.
Fig.4. Odd columns stdev parameter upper right quadrant of the detector.
Fig.7. Odd columns stdev parameter lower left quadrant of the detector.
Fig.8. Odd columns stdev parameter lower right quadrant of the detector.
This QC1 parameters are sensitive to changes in the linearity of odd and even
columns separately.
Find more information about ISAAC QC parameters derived from twilight flats
here.
General information
Click on any of the plots to see a close-up version.
If applicable, the latest values from Paranal ops logs are plotted as blue dots. More information about those values, including a download option, is available in the OPS column.
The latest date is indicated on top of the plot, data points belonging to that date are specially marked.
If configured,
- statistical averages are indicated by a solid line, and thresholds by broken lines
- outliers are marked by a red asterisk. They are defined as data points outside the
threshold lines
- "aliens" (= data points outside the plot Y limits) are marked by a red arrow (↑ or ↓)
- you can download the data for each parameter set if the 'Data downloads' link shows up
|

