Plot
? |
Symb
? |
Source
* |
OPS?
** |
Average ? |
Thresholds ? |
N_
data |
QC1
parameter |
Data
downloads |
Remarks |
| method |
value |
unit |
method |
value |
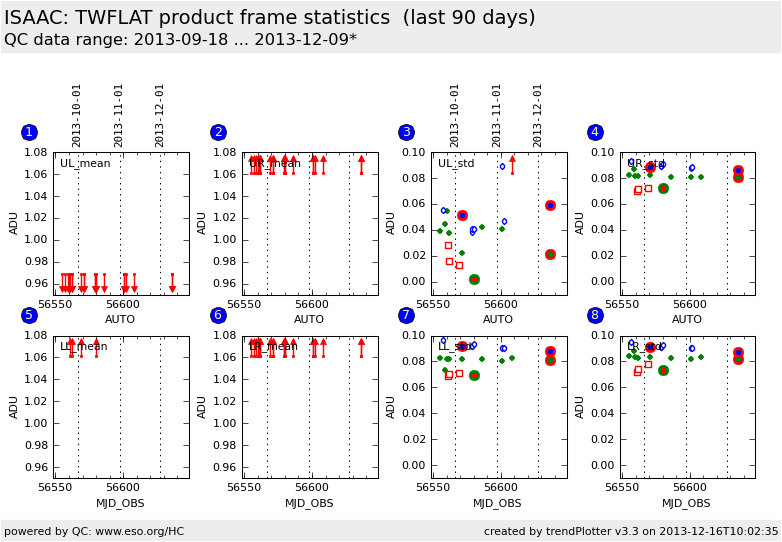
| 1 |
□ | QC1DB |
no |
none |
|
ADU |
none | |
4 |
tot_UL |
this |
last_yr |
all
|
MASTER_IMG_FLAT Ks-band mean counts in a selected quadrant window |
| 1 |
• | QC1DB |
no |
none |
|
ADU |
none | |
9 |
tot_UL |
this |
last_yr |
all
|
MASTER_IMG_FLAT H-band mean counts in a selected quadrant window |
| 1 |
o | QC1DB |
no |
none |
|
ADU |
none | |
7 |
tot_UL |
this |
last_yr |
all
|
MASTER_IMG_FLAT J-band mean counts in a selected quadrant window |
| 1 |
• | QC1DB |
no |
none |
|
ADU |
none | |
1 |
tot_UL |
this |
last_yr |
all
|
MASTER_IMG_FLAT Js-band mean counts in a selected quadrant window |
| 2 |
□ | QC1DB |
no |
none |
|
ADU |
none | |
4 |
tot_UR |
this |
last_yr |
all
|
MASTER_IMG_FLAT Ks-band mean counts in a selected quadrant window |
| 2 |
• | QC1DB |
no |
none |
|
ADU |
none | |
9 |
tot_UR |
this |
last_yr |
all
|
MASTER_IMG_FLAT H-band mean counts in a selected quadrant window |
| 2 |
o | QC1DB |
no |
none |
|
ADU |
none | |
7 |
tot_UR |
this |
last_yr |
all
|
MASTER_IMG_FLAT J-band mean counts in a selected quadrant window |
| 2 |
• | QC1DB |
no |
none |
|
ADU |
none | |
1 |
tot_UR |
this |
last_yr |
all
|
MASTER_IMG_FLAT Js-band mean counts in a selected quadrant window |
| 3 |
□ | QC1DB |
no |
none |
|
ADU |
none | |
4 |
std_UL |
this |
last_yr |
all
|
MASTER_IMG_FLAT Ks-band standard deviation in a selected quadrant window |
| 3 |
• | QC1DB |
no |
none |
|
ADU |
none | |
9 |
std_UL |
this |
last_yr |
all
|
MASTER_IMG_FLAT H-band standard deviation in a selected quadrant window |
| 3 |
o | QC1DB |
no |
none |
|
ADU |
none | |
7 |
std_UL |
this |
last_yr |
all
|
MASTER_IMG_FLAT J-band standard deviation in a selected quadrant window |
| 3 |
• | QC1DB |
no |
none |
|
ADU |
none | |
1 |
std_UL |
this |
last_yr |
all
|
MASTER_IMG_FLAT Js-band standard deviation in a selected quadrant window |
| 4 |
□ | QC1DB |
no |
none |
|
ADU |
none | |
4 |
std_UR |
this |
last_yr |
all
|
MASTER_IMG_FLAT Ks-band standard deviation in a selected quadrant window |
| 4 |
• | QC1DB |
no |
none |
|
ADU |
none | |
9 |
std_UR |
this |
last_yr |
all
|
MASTER_IMG_FLAT H-band standard deviation in a selected quadrant window |
| 4 |
o | QC1DB |
no |
none |
|
ADU |
none | |
7 |
std_UR |
this |
last_yr |
all
|
MASTER_IMG_FLAT J-band standard deviation in a selected quadrant window |
| 4 |
• | QC1DB |
no |
none |
|
ADU |
none | |
1 |
std_UR |
this |
last_yr |
all
|
MASTER_IMG_FLAT Js-band standard deviation in a selected quadrant window |
| 5 |
□ | QC1DB |
no |
none |
|
ADU |
none | |
4 |
tot_LL |
this |
last_yr |
all
|
MASTER_IMG_FLAT Ks-band mean counts in a selected quadrant window |
| 6 |
□ | QC1DB |
no |
none |
|
ADU |
none | |
4 |
tot_LR |
this |
last_yr |
all
|
MASTER_IMG_FLAT Ks-band mean counts in a selected quadrant window |
| 6 |
• | QC1DB |
no |
none |
|
ADU |
none | |
9 |
tot_LR |
this |
last_yr |
all
|
MASTER_IMG_FLAT H-band mean counts in a selected quadrant window |
| 6 |
o | QC1DB |
no |
none |
|
ADU |
none | |
7 |
tot_LR |
this |
last_yr |
all
|
MASTER_IMG_FLAT J-band mean counts in a selected quadrant window |
| 6 |
• | QC1DB |
no |
none |
|
ADU |
none | |
1 |
tot_LR |
this |
last_yr |
all
|
MASTER_IMG_FLAT Js-band mean counts in a selected quadrant window |
| 7 |
□ | QC1DB |
no |
none |
|
ADU |
none | |
4 |
std_LL |
this |
last_yr |
all
|
MASTER_IMG_FLAT Ks-band standard deviation in a selected quadrant window |
| 7 |
• | QC1DB |
no |
none |
|
ADU |
none | |
9 |
std_LL |
this |
last_yr |
all
|
MASTER_IMG_FLAT H-band standard deviation in a selected quadrant window |
| 7 |
o | QC1DB |
no |
none |
|
ADU |
none | |
7 |
std_LL |
this |
last_yr |
all
|
MASTER_IMG_FLAT J-band standard deviation in a selected quadrant window |
| 7 |
• | QC1DB |
no |
none |
|
ADU |
none | |
1 |
std_LL |
this |
last_yr |
all
|
MASTER_IMG_FLAT Js-band standard deviation in a selected quadrant window |
| 8 |
□ | QC1DB |
no |
none |
|
ADU |
none | |
4 |
std_LR |
this |
last_yr |
all
|
MASTER_IMG_FLAT Ks-band standard deviation in a selected quadrant window |
| 8 |
• | QC1DB |
no |
none |
|
ADU |
none | |
9 |
std_LR |
this |
last_yr |
all
|
MASTER_IMG_FLAT H-band standard deviation in a selected quadrant window |
| 8 |
o | QC1DB |
no |
none |
|
ADU |
none | |
7 |
std_LR |
this |
last_yr |
all
|
MASTER_IMG_FLAT J-band standard deviation in a selected quadrant window |
| 8 |
• | QC1DB |
no |
none |
|
ADU |
none | |
1 |
std_LR |
this |
last_yr |
all
|
MASTER_IMG_FLAT Js-band standard deviation in a selected quadrant window |
| |
|
*Data sources: QC1DB: QC1 database; LOCAL: local text file | **OPS: OPSLOG data are included
|

