Plot
? |
Symb
? |
Source
* |
OPS?
** |
Average ? |
Thresholds ? |
N_
data |
QC1
parameter |
Data
downloads |
Remarks |
| method |
value |
unit |
method |
value |
| 1 |
• | QC1DB |
yes (0) |
MEDIAN |
514 |
PIXEL |
VAL | 495,535 |
411 |
qc_slit_x |
this |
last_yr |
all
|
X-position |
| 2 |
• | QC1DB |
yes (0) |
MEDIAN |
487 |
PIXEL |
VAL | 480,520 |
411 |
qc_slit_y |
this |
last_yr |
all
|
Y-position |
| 3 |
• | QC1DB |
yes (0) |
MEDIAN |
270 |
DEGREE |
VAL | 269,270.2 |
411 |
qc_slit_a |
this |
last_yr |
all
|
Tilt angle |
| 4 |
• | QC1DB |
yes (0) |
MEDIAN |
2.17e+06 |
ADU |
50% | ± 1.08e+06 |
411 |
qc_slit_f |
this |
last_yr |
all
|
Arc line flux |
| 5 |
• | QC1DB |
no |
MEDIAN |
1.35 |
PIXEL |
none | |
411 |
qc_slit_fwhm |
this |
last_yr |
all
|
FWHM |
| |
|
*Data sources: QC1DB: QC1 database; LOCAL: local text file | **OPS: OPSLOG data are included
|
Plot 1
scores: not implemented
| | data source: | isaac_slit
(QC1 database) |
| dataset: | qc_slit_x | • |
| median: | 514 | PIXEL |
| fixed thresholds: | 495...535 | PIXEL |
| N_data plotted: | 411 |
| [click on plot for closeup] |
Plot 2
scores: not implemented
| | data source: | isaac_slit
(QC1 database) |
| dataset: | qc_slit_y | • |
| median: | 487 | PIXEL |
| fixed thresholds: | 480...520 | PIXEL |
| N_data plotted: | 411 |
| [click on plot for closeup] |
Plot 3
scores: not implemented
| | data source: | isaac_slit
(QC1 database) |
| dataset: | qc_slit_a | • |
| median: | 270 | DEGREE |
| fixed thresholds: | 269...270.2 | DEGREE |
| N_data plotted: | 411 |
| [click on plot for closeup] |
Plot 4
scores: not implemented
| | data source: | isaac_slit
(QC1 database) |
| dataset: | qc_slit_f | • |
| median: | 2.17e+06 | ADU |
| rel. thresholds: ±50% | 1082740.0...3248220.0 | ADU |
| N_data plotted: | 411 |
| [click on plot for closeup] |
Plot 5
scores: not implemented
| | data source: | isaac_slit
(QC1 database) |
| dataset: | qc_slit_fwhm | • |
| median: | 1.35 | PIXEL |
| thresholds: | none | |
| N_data plotted: | 411 |
| [click on plot for closeup] |
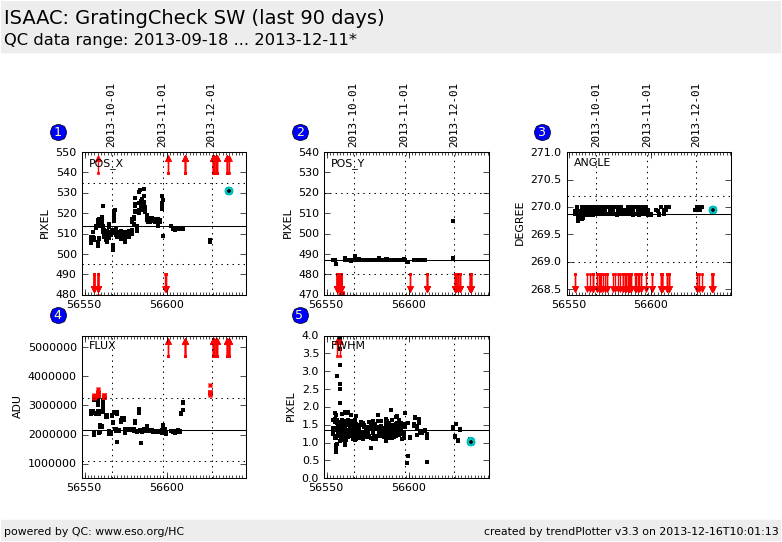
This is the trending plot for the Daily Grating Position Check (SW-arm)
This plot describes:
1. The x-position of the bright arc line for the setting: SW MR 1.4097.
2. The y-position of the bright arc line.
3. The tilt angle of the bright arc line.
4. The flux of the bright arc line.
5. The fwhm of the bright arc line.
A single frame showing only one bright arc line (with some low flux arc lines that
are ignored by the recipe) is submitted to the slit recipe
to get some basic geometrical QC information.
Find more information about ISAAC slit frames
here.
General information
Click on any of the plots to see a close-up version.
If applicable, the latest values from Paranal ops logs are plotted as blue dots. More information about those values, including a download option, is available in the OPS column.
The latest date is indicated on top of the plot, data points belonging to that date are specially marked.
If configured,
- statistical averages are indicated by a solid line, and thresholds by broken lines
- outliers are marked by a red asterisk. They are defined as data points outside the
threshold lines
- "aliens" (= data points outside the plot Y limits) are marked by a red arrow (↑ or ↓)
- you can download the data for each parameter set if the 'Data downloads' link shows up
|

