Plot
? |
Symb
? |
Source
* |
OPS?
** |
Average ? |
Thresholds ? |
N_
data |
QC1
parameter |
Data
downloads |
Remarks |
| method |
value |
unit |
method |
value |
| 1 |
• | QC1DB |
yes (0) |
MEDIAN |
510 |
PIXEL |
VAL | 500,521 |
154 |
qc_slit_x |
this |
last_yr |
all
|
X-position of the slit image |
| 2 |
• | QC1DB |
yes (0) |
MEDIAN |
492 |
PIXEL |
VAL | 520,540 |
154 |
qc_slit_y |
this |
last_yr |
all
|
Y-position of the slit image |
| 3 |
• | QC1DB |
yes (0) |
MEDIAN |
-89.6 |
DEGREE |
none | |
154 |
qc_slit_a |
this |
last_yr |
all
|
Tilt angle of the slit image |
| 4 |
• | QC1DB |
yes (0) |
MEDIAN |
4.59e+06 |
ADU |
none | |
154 |
qc_slit_f |
this |
last_yr |
all
|
integrated flux of the slit image |
| |
|
*Data sources: QC1DB: QC1 database; LOCAL: local text file | **OPS: OPSLOG data are included
|
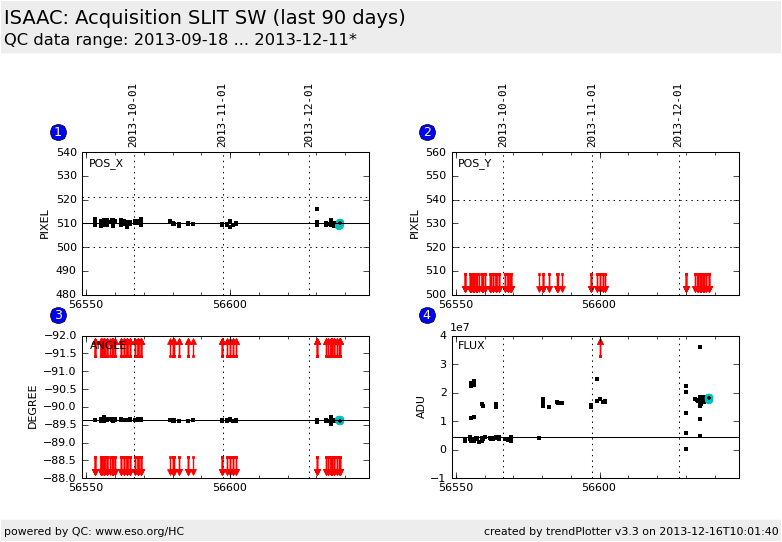
Plot 1
scores: not implemented
| | data source: | isaac_slit
(QC1 database) |
| dataset: | qc_slit_x | • |
| median: | 510 | PIXEL |
| fixed thresholds: | 500...521 | PIXEL |
| N_data plotted: | 154 |
| [click on plot for closeup] |
Plot 2
scores: not implemented
| | data source: | isaac_slit
(QC1 database) |
| dataset: | qc_slit_y | • |
| median: | 492 | PIXEL |
| fixed thresholds: | 520...540 | PIXEL |
| N_data plotted: | 154 |
| [click on plot for closeup] |
Plot 3
scores: not implemented
| | data source: | isaac_slit
(QC1 database) |
| dataset: | qc_slit_a | • |
| median: | -89.6 | DEGREE |
| thresholds: | none | |
| N_data plotted: | 154 |
| [click on plot for closeup] |
Plot 4
scores: not implemented
| | data source: | isaac_slit
(QC1 database) |
| dataset: | qc_slit_f | • |
| median: | 4.59e+06 | ADU |
| thresholds: | none | |
| N_data plotted: | 154 |
| [click on plot for closeup] |
This is the trending plot of the through slit images
taken as part of the acquisition template for spectroscopy.
This plot describes:
1. The x-position of the slit image.
2. The y-position of the slit image.
3. The tilt angle of the slit image.
4. The flux of the slit image.
The ISAAC acquisition template used for spectroscopy (science observations as well as
standard stars use to calibrate telluric lines) generates an acquisition image,
or a difference image with TPL.EXPNO=1, followed by an unpredicted number of
through slit images taken in an interactive way by the night time astronomer to align
the optics. Only the first in the sequence of the through slit images with TPL.EXPNO=2 is
investigated here to check how far the camera has been moved after the last alignment.
Find more information about ISAAC slit frames
here.
General information
Click on any of the plots to see a close-up version.
If applicable, the latest values from Paranal ops logs are plotted as blue dots. More information about those values, including a download option, is available in the OPS column.
The latest date is indicated on top of the plot, data points belonging to that date are specially marked.
If configured,
- statistical averages are indicated by a solid line, and thresholds by broken lines
- outliers are marked by a red asterisk. They are defined as data points outside the
threshold lines
- "aliens" (= data points outside the plot Y limits) are marked by a red arrow (↑ or ↓)
- you can download the data for each parameter set if the 'Data downloads' link shows up
|

