ISAAC trending system: HEALTH CHECK report
Last update: 2013-12-16T10:34:46 (UT)
[enable javascript for displaying time difference!]
General news:
NOTE: The Health Check and calChecker services have been moved to qcFlow. These pages are only maintained for comparison
and will be removed in 2026.
ISAAC news:
2013-12-16: due to ISAAC decommissioning, refreshing of the health checks disabled
Report news:
Print: Information and research:
- png file
- advanced studies:
QC1 browser |
QC1 plotter
From 2008-04 on the max counts is no longer 4000 ADU but 20000 ADU. The effective non-linearity correction at 10000 ADU is no longer an extrapolation.
Plot? Symb? Source OPS? Average ? Thresholds ? N_ QC1 Data Remarks
method value unit method value
1
o QC1DB yes (0) MEDIAN 1.81e+04 ratio VAL -0.05,0.05 2 qc_detlin_eff
this |
last_yr |
all
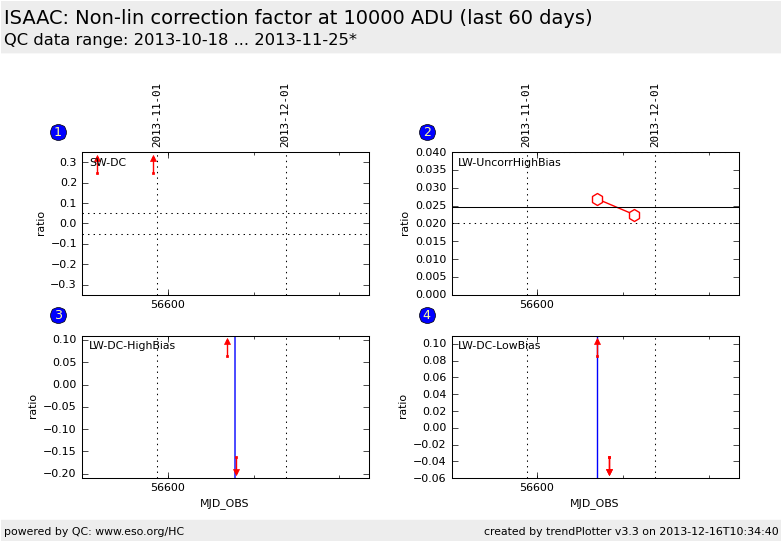
SW-arm, DoubleCorr nonlinearity correction fraction at 10000 ADU
2
o QC1DB yes (0) MEDIAN 0.0247 ratio VAL 0.02,0.04 2 qc_detlin_eff
this |
last_yr |
all
LW, UncorrHighBias nonlinearity correction fraction at 10000 ADU
3
o QC1DB yes (0) MEDIAN 277 ratio none 2 qc_detlin_eff
this |
last_yr |
all
LW, DoubleCorrHighBias nonlinearity correction fraction at 10000 ADU
4
o QC1DB yes (0) MEDIAN -1.11e+05 ratio none 3 qc_detlin_eff
this |
last_yr |
all
LW, DoubleCorrLowBias nonlinearity correction fraction at 10000 ADU
*Data sources: QC1DB: QC1 database; LOCAL: local text file | **OPS: OPSLOG data are included
Plot 1 scores: not implemented
data source: isaac_line dataset: qc_detlin_eff o median: 1.81e+04 ratio fixed thresholds: -0.05...0.05 ratio N_data plotted: 2 [click on plot for closeup]
Plot 2 scores: not implemented
data source: isaac_line dataset: qc_detlin_eff o median: 0.0247 ratio fixed thresholds: 0.02...0.04 ratio N_data plotted: 2 [click on plot for closeup]
Plot 3 scores: not implemented
data source: isaac_line dataset: qc_detlin_eff o median: 277 ratio thresholds: none N_data plotted: 2 [click on plot for closeup]
Plot 4 scores: not implemented
data source: isaac_line dataset: qc_detlin_eff o median: -1.11e+05 ratio thresholds: none N_data plotted: 3 [click on plot for closeup]
General information
Click on any of the plots to see a close-up version .
If applicable, the latest values from Paranal ops logs are plotted as blue dots. More information about those values, including a download option, is available in the OPS column.
The latest date is indicated on top of the plot, data points belonging to that date are specially marked.
If configured,
statistical averages are indicated by a solid line, and thresholds by broken lines outliers are marked by a red asterisk. They are defined as data points outside the
threshold lines "aliens" (= data points outside the plot Y limits) are marked by a red arrow (↑ ↓ you can download the data for each parameter set if the 'Data downloads' link shows up

