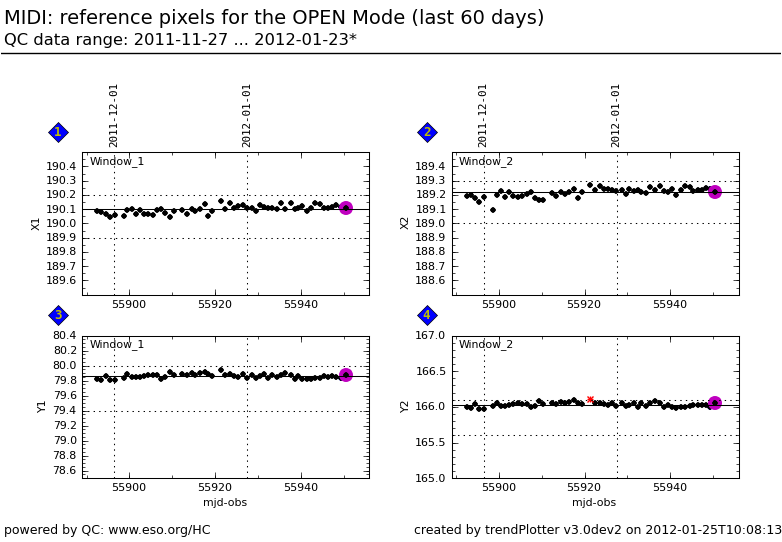
Plot
? |
Symb
? |
Source
* |
OPS?
** |
Average ? |
Thresholds ? |
N_
data |
QC1
parameter |
Data
downloads |
Remarks |
| method |
value |
unit |
method |
value |
| 1 |
• | QC1DB |
yes (3) |
MEDIAN |
190.10423 |
NONE |
VAL | 189.9,190.2 |
57 |
open_beamA_X |
this |
last_yr |
all
|
|
| 2 |
• | QC1DB |
yes (3) |
MEDIAN |
189.22456 |
NONE |
VAL | 189,189.3 |
57 |
open_beamB_X |
this |
last_yr |
all
|
|
| 3 |
• | QC1DB |
yes (3) |
MEDIAN |
79.85847 |
NONE |
VAL | 79.4,80 |
57 |
open_beamA_Y |
this |
last_yr |
all
|
|
| 4 |
• | QC1DB |
yes (3) |
MEDIAN |
166.0311 |
NONE |
VAL | 165.6,166.1 |
57 |
open_beamB_Y |
this |
last_yr |
all
|
|
| |
|
*Data sources: QC1DB: QC1 database; LOCAL: local text file | **OPS: to indicate that OPSLOG data are included
|
Plot 1
scores:  8| 8|
| | data source: | midi_refpix
(QC1 database) |
| dataset: | open_beamA_X | • |
| median: | 190.10423 | NONE |
| fixed thresholds: | 189.89999...190.2 | NONE |
| N_data plotted: | 57 |
| [click on plot for closeup] |
Plot 2
scores: 8|
| | data source: | midi_refpix
(QC1 database) |
| dataset: | open_beamB_X | • |
| median: | 189.22456 | NONE |
| fixed thresholds: | 189.0...189.3 | NONE |
| N_data plotted: | 57 |
| [click on plot for closeup] |
Plot 3
scores: 8|
| | data source: | midi_refpix
(QC1 database) |
| dataset: | open_beamA_Y | • |
| median: | 79.85847 | NONE |
| fixed thresholds: | 79.4...80.0 | NONE |
| N_data plotted: | 57 |
| [click on plot for closeup] |
Plot 4
scores: 8|
| | data source: | midi_refpix
(QC1 database) |
| dataset: | open_beamB_Y | • |
| median: | 166.0311 | NONE |
| fixed thresholds: | 165.60001...166.10001 | NONE |
| N_data plotted: | 57 |
| [click on plot for closeup] |
The reference pixels of MIDI are the two pixels of the detector onto
which the centroids of the target images must fall in order to ensure a
proper beam overlap. They are measured using the center of a pinhole,
in the 3 set-ups OPEN, HIGH_SENS and SCI_PHOT, for telescopes beams A
and B feeding MIDI, for the interferometric channnels 1 and 2 of MIDI,
and for the photometric channels PA and PB of MIDI (in SCI_PHOT only).
General information
Click on any of the plots to see a close-up version.
If applicable, the latest values from Paranal ops logs are plotted as blue dots. More information about those values, including a download option, is available in the OPS column.
The latest date is indicated on top of the plot, data points belonging to that date are specially marked.
If configured,
- statistical averages are indicated by a solid line, and thresholds by broken lines
- outliers are marked by a red asterisk. They are defined as data points outside the
threshold lines
- "aliens" (= data points outside the plot Y limits) are marked by a red arrow (↑ or ↓)
- you can download the data for each parameter set if the 'Data downloads' link shows up
|
 mirror sites:
PL (internal
link) HQ
[?]
mirror sites:
PL (internal
link) HQ
[?]
 score overview