Plot
? |
Symb
? |
Source
* |
Average ? |
Thresholds ? |
N_
data |
QC1
parameter |
Data
downloads |
Remarks |
| method |
value |
unit |
method |
value |
| 1 |
• | QC1DB |
FIXED |
1.17e+04 |
ADU |
none | |
85 |
max_count |
this |
last_yr |
all
|
ADU of brightest non-rejected flat used by recipe |
| 1 |
• | QC1DB |
FIXED |
1.17e+04 |
ADU |
none | |
85 |
brightest_counts |
this |
last_yr |
all
|
ADU in brightest flat genarated by template |
| 1 |
• | QC1DB |
FIXED |
1.17e+04 |
ADU |
none | |
85 |
fit_c0 |
this |
last_yr |
all
|
saturation level derived from fit |
| 2 |
• | QC1DB |
FIXED |
3.3e+03 |
ADU |
none | |
83 |
max_count |
this |
last_yr |
all
|
ADU of brightest non-rejected flat used by recipe |
| 2 |
• | QC1DB |
FIXED |
3.3e+03 |
ADU |
none | |
83 |
brightest_counts |
this |
last_yr |
all
|
ADU in brightest flat generated by template |
| 2 |
• | QC1DB |
FIXED |
3.3e+03 |
ADU |
none | |
83 |
fit_c0 |
this |
last_yr |
all
|
saturation level derived from fit |
| 3 |
• | QC1DB |
FIXED |
1.64e+04 |
ADU |
none | |
13 |
max_count |
this |
last_yr |
all
|
ADU of brightest non-rejected flat used by recipe |
| 3 |
• | QC1DB |
FIXED |
1.64e+04 |
ADU |
none | |
13 |
brightest_counts |
this |
last_yr |
all
|
ADU in brightest flat generated by template |
| 3 |
• | QC1DB |
FIXED |
1.64e+04 |
ADU |
none | |
13 |
fit_c0 |
this |
last_yr |
all
|
saturation level derived from fit |
| 4 |
• | QC1DB |
FIXED |
9.5e+03 |
ADU |
none | |
12 |
max_count |
this |
last_yr |
all
|
ADU of brightest non-rejected flat used by recipe |
| 4 |
• | QC1DB |
FIXED |
9.5e+03 |
ADU |
none | |
12 |
brightest_counts |
this |
last_yr |
all
|
ADU in brightest flat generated by template |
| 4 |
• | QC1DB |
FIXED |
9.5e+03 |
ADU |
none | |
12 |
fit_c0 |
this |
last_yr |
all
|
saturation level derived from fit |
| |
|
*Data sources: QC1DB: QC1 database; LOCAL: local data source
|
Plot 1
scores: not implemented
| | data source: | naco_detmon
(QC1 database) |
dataset:
(numbers below apply to this dataset) | max_count | • |
| fixed average: | 1.17e+04 | ADU |
| thresholds: | none | |
| N_data plotted: | 85 |
| [click plot for closeup] |
Plot 2
scores: not implemented
| | data source: | naco_detmon
(QC1 database) |
dataset:
(numbers below apply to this dataset) | max_count | • |
| fixed average: | 3.3e+03 | ADU |
| thresholds: | none | |
| N_data plotted: | 83 |
| [click plot for closeup] |
Plot 3
scores: not implemented
| | data source: | naco_detmon
(QC1 database) |
dataset:
(numbers below apply to this dataset) | max_count | • |
| fixed average: | 1.64e+04 | ADU |
| thresholds: | none | |
| N_data plotted: | 13 |
| [click plot for closeup] |
Plot 4
scores: not implemented
| | data source: | naco_detmon
(QC1 database) |
dataset:
(numbers below apply to this dataset) | max_count | • |
| fixed average: | 9.5e+03 | ADU |
| thresholds: | none | |
| N_data plotted: | 12 |
| [click plot for closeup] |
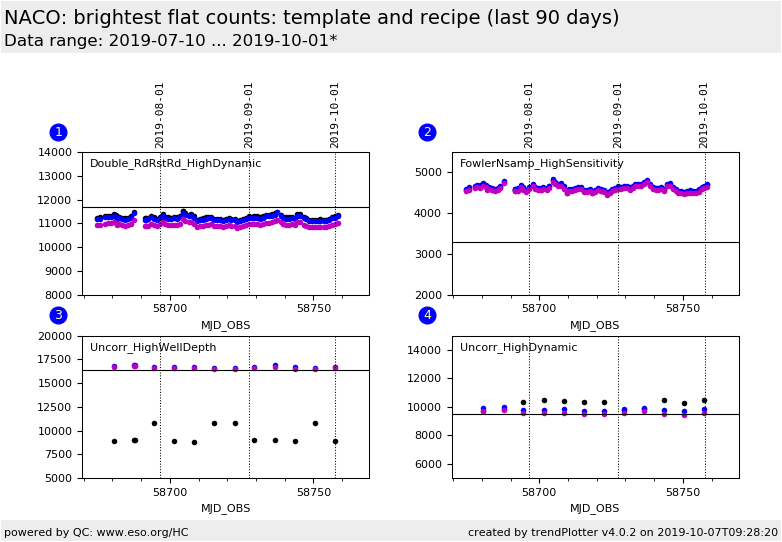
This plot shows the median counts in lamp flat raw frames acquired by the detmon template.
- Blue points are the counts in the brightest raw flat from the sequence of flat and dark frames generated by the detmon template.
Ideally, these values should reach the saturation value of the detector.
- Black points are the counts in that brightest flat, already correct for the dark level, used for the non-linearity analysis of the detmon recipe,
(and has not been rejected by the recipe).
There is a recipe configuration parameter that rejects flats above a certain brightness.
This parameter is for reasons to homogenize the input sequence for the recipe to achieve a better stability.
- The black line is the saturation level.
General information
Click on any of the plots to see a close-up version.
The latest date is indicated on top of the plot.
If configured,
- data points belonging to the latest date are specially marked
- statistical averages are indicated by a solid line, and thresholds by broken lines
- outliers are marked by a red asterisk. They are defined as data points outside the
threshold lines
- "aliens" (= data points outside the plot Y limits) are marked by a red arrow (↑ or ↓)
- you can download the data for each parameter set if the 'Data downloads' link shows up
|
