Plot
? |
Symb
? |
Source
* |
Average ? |
Thresholds ? |
N_
data |
QC1
parameter |
Data
downloads |
Remarks |
| method |
value |
unit |
method |
value |
| 1 |
• | QC1DB |
MEDIAN |
13.8 |
e-/ADU |
VAL | 11.6,15.6 |
85 |
gain |
this |
last_yr |
all
|
Double_RdRstRd/HighDynamic gain |
| 2 |
• | QC1DB |
MEDIAN |
13.7 |
e-/ADU |
VAL | 11.5,15.5 |
83 |
gain |
this |
last_yr |
all
|
FowlerNsamp/HighSensitivity gain |
| 3 |
• | QC1DB |
MEDIAN |
9.4 |
e-/ADU |
VAL | 7.2,11.2 |
13 |
gain |
this |
last_yr |
all
|
Uncorr/HighWellDepth gain |
| 4 |
• | QC1DB |
MEDIAN |
13.6 |
e-/ADU |
VAL | 11.2,15.2 |
12 |
gain |
this |
last_yr |
all
|
Uncorr/HighDynamic gain |
| |
|
*Data sources: QC1DB: QC1 database; LOCAL: local data source
|
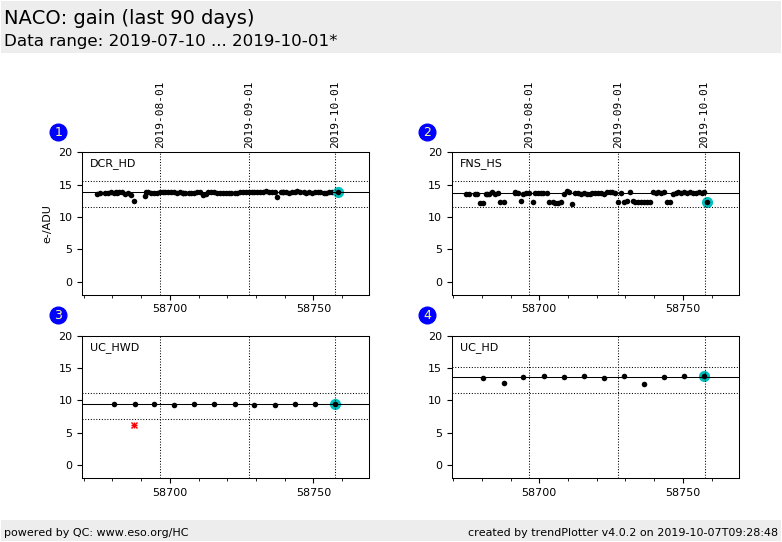
Plot 1
scores:  8| 8|
| | data source: | naco_detmon
(QC1 database) |
| dataset: | gain | • |
| median: | 13.8 | e-/ADU |
| fixed thresholds: | 11.6...15.6 | e-/ADU |
| N_data plotted: | 85 |
| [click plot for closeup] |
Plot 2
scores: 8|
| | data source: | naco_detmon
(QC1 database) |
| dataset: | gain | • |
| median: | 13.7 | e-/ADU |
| fixed thresholds: | 11.5...15.5 | e-/ADU |
| N_data plotted: | 83 |
| [click plot for closeup] |
Plot 3
scores: 2|
| | data source: | naco_detmon
(QC1 database) |
| dataset: | gain | • |
| median: | 9.4 | e-/ADU |
| fixed thresholds: | 7.2...11.2 | e-/ADU |
| N_data plotted: | 13 |
| [click plot for closeup] |
Plot 4
scores: 2|
| | data source: | naco_detmon
(QC1 database) |
| dataset: | gain | • |
| median: | 13.6 | e-/ADU |
| fixed thresholds: | 11.2...15.2 | e-/ADU |
| N_data plotted: | 12 |
| [click plot for closeup] |
This plot shows the gain values derived from the photon transfer curve
applied in the detmon recipe. The autocorrelation checks are
switched off for the pipeline processing, hence gain values are not
corrected for inter-pixel capacitance.
The analysis region for gain, fpn, non-linearity and counts is confined to the
upper right 512x512 pixel large detector quadrant.
In case correlated 8-pixel column noise shows up in the upper right detector quadrant,
the derived gain value is biased.
General information
Click on any of the plots to see a close-up version.
The latest date is indicated on top of the plot.
If configured,
- data points belonging to the latest date are specially marked
- statistical averages are indicated by a solid line, and thresholds by broken lines
- outliers are marked by a red asterisk. They are defined as data points outside the
threshold lines
- "aliens" (= data points outside the plot Y limits) are marked by a red arrow (↑ or ↓)
- you can download the data for each parameter set if the 'Data downloads' link shows up
|
