Plot
? |
Symb
? |
Source
* |
Average ? |
Thresholds ? |
N_
data |
QC1
parameter |
Data
downloads |
Remarks |
| method |
value |
unit |
method |
value |
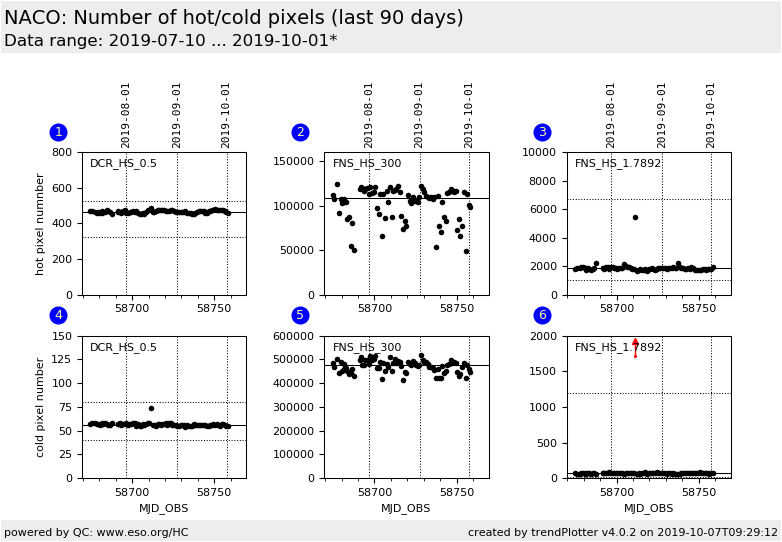
| 1 |
• | QC1DB |
MEDIAN |
466 |
number |
VAL | 326,526 |
83 |
num_hot |
this |
last_yr |
all
|
Double ReadResetRead DIT=0.5 |
| 2 |
• | QC1DB |
MEDIAN |
1.09e+05 |
number |
none | |
83 |
num_hot |
this |
last_yr |
all
|
FowlerNSample DIT=300s |
| 3 |
• | QC1DB |
MEDIAN |
1.86e+03 |
number |
VAL | 1000,6700 |
83 |
num_hot |
this |
last_yr |
all
|
FowlerNSample DIT=1.7892s |
| 4 |
• | QC1DB |
MEDIAN |
56 |
number |
VAL | 40,80 |
83 |
num_cold |
this |
last_yr |
all
|
Double ReadResetRead DIT=0.5 |
| 5 |
• | QC1DB |
MEDIAN |
4.75e+05 |
number |
none | |
83 |
num_cold |
this |
last_yr |
all
|
FowlerNSample DIT=300s |
| 6 |
• | QC1DB |
MEDIAN |
69 |
number |
VAL | 20,1200 |
83 |
num_cold |
this |
last_yr |
all
|
FowlerNSample DIT=1.7892s |
| |
|
*Data sources: QC1DB: QC1 database; LOCAL: local data source
|
Plot 1
scores: no current data
| | data source: | naco_dark
(QC1 database) |
| dataset: | num_hot | • |
| median: | 466 | number |
| fixed thresholds: | 326...526 | number |
| N_data plotted: | 83 |
| [click plot for closeup] |
Plot 2
scores: not implemented
| | data source: | naco_dark
(QC1 database) |
| dataset: | num_hot | • |
| median: | 1.09e+05 | number |
| thresholds: | none | |
| N_data plotted: | 83 |
| [click plot for closeup] |
Plot 3
scores: no current data
| | data source: | naco_dark
(QC1 database) |
| dataset: | num_hot | • |
| median: | 1.86e+03 | number |
| fixed thresholds: | 1000...6700 | number |
| N_data plotted: | 83 |
| [click plot for closeup] |
Plot 4
scores: no current data
| | data source: | naco_dark
(QC1 database) |
| dataset: | num_cold | • |
| median: | 56 | number |
| fixed thresholds: | 40...80 | number |
| N_data plotted: | 83 |
| [click plot for closeup] |
Plot 5
scores: not implemented
| | data source: | naco_dark
(QC1 database) |
| dataset: | num_cold | • |
| median: | 4.75e+05 | number |
| thresholds: | none | |
| N_data plotted: | 83 |
| [click plot for closeup] |
Plot 6
scores: no current data
| | data source: | naco_dark
(QC1 database) |
| dataset: | num_cold | • |
| median: | 69 | number |
| fixed thresholds: | 20...1200 | number |
| N_data plotted: | 83 |
| [click plot for closeup] |
Number of hot and cold pixels, as calculated by the "naco_img_dark"
recipe of the NACO pipeline, shown for three daily acquired
read modes.
Default pipeline recipe parameters are used:
hot pixel are pixel with a dark current above median + 10 ADU.
cold pixel are pixel with a dark current below median - 6 ADU.
Since 2015 we use: --hot_t = 14 ADU and --cold_t = 10 ADU.
For the daily darks with
setup FNS_HS_300, the large scale background pattern has a higher amplitude
than the amplitude of the hot and cold pixels. Therefore values of this setup is not
scored.
General information
Click on any of the plots to see a close-up version.
The latest date is indicated on top of the plot.
If configured,
- data points belonging to the latest date are specially marked
- statistical averages are indicated by a solid line, and thresholds by broken lines
- outliers are marked by a red asterisk. They are defined as data points outside the
threshold lines
- "aliens" (= data points outside the plot Y limits) are marked by a red arrow (↑ or ↓)
- you can download the data for each parameter set if the 'Data downloads' link shows up
|
