Plot
? |
Symb
? |
Source
* |
Average ? |
Thresholds ? |
N_
data |
QC1
parameter |
Data
downloads |
Remarks |
| method |
value |
unit |
method |
value |
| 1 |
• | QC1DB |
MEDIAN |
12.5 |
ADU |
VAL | 0.0,25.0 |
50 |
qc_darkmed_ave |
this |
last_yr |
all
|
median dark level, as computed from the master dark |
| 2 |
• | QC1DB |
MEDIAN |
0.732 |
ADU |
VAL | -3.0,4.0 |
50 |
qc_darkmed_stdev |
this |
last_yr |
all
|
standard deviation of median dark level |
| 3 |
• | QC1DB |
MEDIAN |
3.16 |
ADU |
VAL | 2.5,3.75 |
50 |
qc_ron2 |
this |
last_yr |
all
|
rms noise derived by subtracting 2 consecutive raw darks (normalized to DET.DIT = 1 second) |
| 4 |
• | QC1DB |
MEDIAN |
2.33 |
ADU |
VAL | 1.0,4.0 |
50 |
qc_gaf_fpn |
this |
last_yr |
all
|
fixed pattern noise as computed by fitting a Gaussian to the master dark histogram |
| 5 |
• | QC1DB |
MEDIAN |
1.01e+04 |
number |
VAL | 2000,20000 |
50 |
qc_bpm_nbadpix |
this |
last_yr |
all
|
number of pixels with a high dark current |
| 6 |
• | QC1DB |
MEDIAN |
0.0225 |
unitless |
VAL | -0.2,0.3 |
50 |
qc_oes1 |
this |
last_yr |
all
|
raw file 1:median ratio of odd-even column stripes in the area of slitlet THIS IS NOT scored |
| 7 |
• | QC1DB |
MEDIAN |
-0.0158 |
unitless |
VAL | -0.2,0.3 |
50 |
qc_oes2 |
this |
last_yr |
all
|
raw file 2:median ratio of odd-even column stripes in the area of slitlet THIS IS NOT scored |
| 8 |
• | QC1DB |
MEDIAN |
-0.0273 |
unitless |
VAL | -0.2,0.3 |
50 |
qc_oes3 |
this |
last_yr |
all
|
raw file 3:median ratio of odd-even column stripes in the area of slitlet THIS IS NOT scored |
| |
|
*Data sources: QC1DB: QC1 database; LOCAL: local data source
|
Plot 1
scores:  4| 4|
| | data source: | sinfoni_dark
(QC1 database) |
| dataset: | qc_darkmed_ave | • |
| median: | 12.5 | ADU |
| fixed thresholds: | 0.0...25.0 | ADU |
| N_data plotted: | 50 |
| [click plot for closeup] |
Plot 2
scores: 4|
| | data source: | sinfoni_dark
(QC1 database) |
| dataset: | qc_darkmed_stdev | • |
| median: | 0.732 | ADU |
| fixed thresholds: | -3.0...4.0 | ADU |
| N_data plotted: | 50 |
| [click plot for closeup] |
Plot 3
scores: 4|
| | data source: | sinfoni_dark
(QC1 database) |
| dataset: | qc_ron2 | • |
| median: | 3.16 | ADU |
| fixed thresholds: | 2.5...3.75 | ADU |
| N_data plotted: | 50 |
| [click plot for closeup] |
Plot 4
scores: 4|
| | data source: | sinfoni_dark
(QC1 database) |
| dataset: | qc_gaf_fpn | • |
| median: | 2.33 | ADU |
| fixed thresholds: | 1.0...4.0 | ADU |
| N_data plotted: | 50 |
| [click plot for closeup] |
Plot 5
scores: 4|
| | data source: | sinfoni_dark
(QC1 database) |
| dataset: | qc_bpm_nbadpix | • |
| median: | 1.01e+04 | number |
| fixed thresholds: | 2000...20000 | number |
| N_data plotted: | 50 |
| [click plot for closeup] |
Plot 6
scores: not implemented
| | data source: | sinfoni_dark
(QC1 database) |
| dataset: | qc_oes1 | • |
| median: | 0.0225 | unitless |
| fixed thresholds: | -0.2...0.3 | unitless |
| N_data plotted: | 50 |
| [click plot for closeup] |
Plot 7
scores: not implemented
| | data source: | sinfoni_dark
(QC1 database) |
| dataset: | qc_oes2 | • |
| median: | -0.0158 | unitless |
| fixed thresholds: | -0.2...0.3 | unitless |
| N_data plotted: | 50 |
| [click plot for closeup] |
Plot 8
scores: not implemented
| | data source: | sinfoni_dark
(QC1 database) |
| dataset: | qc_oes3 | • |
| median: | -0.0273 | unitless |
| fixed thresholds: | -0.2...0.3 | unitless |
| N_data plotted: | 50 |
| [click plot for closeup] |
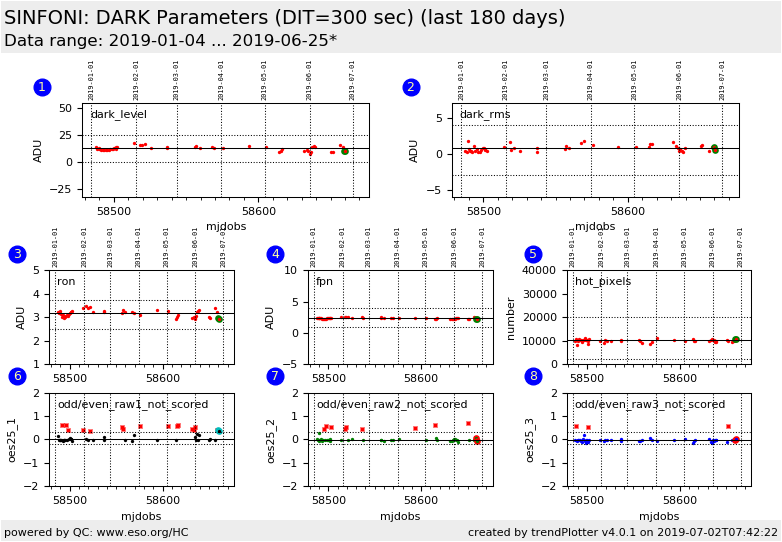
These are the trending plots for the SINFONI QC parameters derived from DARK frames.
These plots describe:
1. the median DARK level, as computed from each master dark frame.
2. the standard deviation of the median DARK level.
3. the root-mean-squared noise, as derived by subtracting two consecutive raw dark frames, computing a median standard deviation in
selected sub-windows, computing a median standard deviation in selected sub-windows in the difference image, and then
normalizing to DET.DIT=1 second.
4. the fixed pattern noise, as computed by fitting a Gaussian to the histogram
of the master dark frames. The fpn is simply the standard deviation of Gaussian.
5. the number of pixels with a high dark current.
6/7/8. the odd-even column stripes in the area of slitlet #25. If med(odd) = median of all odd columns in the area of slitlet #25
and med(even) = median of all even columns in the area of slitlet #25 then, this plot is defined as:
oes25 = 2 * (med(odd) - med(even)) / (med(odd) + med(even))
the plots show the effect for the first 3 raw files of the DARK
DARK current and RON higher than usual could be due to an increase of the detector temperature (INS.TEMP6.VAL), grating temperature (INS.TEMP13.VAL) or of the rack
temperature (INS.TEMP6.VAL). Check also INS.SENS13.ST (Detector warm mode).
Find more information about SINFONI DARK frames
here.
Other QC parameters related to detector properties (like dark level,
linearity, gain, etc.) are also trended
here.
General information
Click on any of the plots to see a close-up version.
The latest date is indicated on top of the plot.
If configured,
- data points belonging to the latest date are specially marked
- statistical averages are indicated by a solid line, and thresholds by broken lines
- outliers are marked by a red asterisk. They are defined as data points outside the
threshold lines
- "aliens" (= data points outside the plot Y limits) are marked by a red arrow (↑ or ↓)
- you can download the data for each parameter set if the 'Data downloads' link shows up
|
