Plot
? |
Symb
? |
Source
* |
Average ? |
Thresholds ? |
N_
data |
QC1
parameter |
Data
downloads |
Remarks |
| method |
value |
unit |
method |
value |
| 1 |
o | QC1DB |
MEDIAN |
5.64 |
pixels |
VAL | -0.10,12 |
91 |
qc_xshift_ul |
this |
last_yr |
all
|
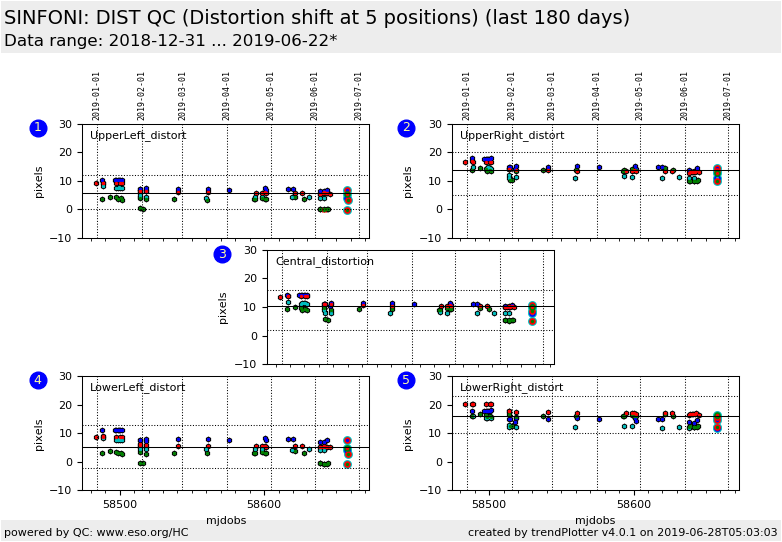
distortion in upper left quadrant of detector for ALL bands [pixels]
(this FULL data set is scored) |
| 1 |
• | QC1DB |
none |
|
pixels |
none | |
22 |
qc_xshift_ul |
this |
last_yr |
all
|
J-band distortion: upper left quadrant of detector [pixels] |
| 1 |
• | QC1DB |
none |
|
pixels |
none | |
17 |
qc_xshift_ul |
this |
last_yr |
all
|
H-band distortion: upper left quadrant of detector [pixels] |
| 1 |
• | QC1DB |
none |
|
pixels |
none | |
27 |
qc_xshift_ul |
this |
last_yr |
all
|
K-band distortion: upper left quadrant of detector [pixels] |
| 1 |
• | QC1DB |
none |
|
pixels |
none | |
25 |
qc_xshift_ul |
this |
last_yr |
all
|
H+K-band distortion: upper left quadrant of detector [pixels] |
|
| 2 |
o | QC1DB |
MEDIAN |
13.7 |
pixels |
VAL | 5,20 |
91 |
qc_xshift_ur |
this |
last_yr |
all
|
distortion in upper right quadrant of detector for ALL bands [pixels]
(this FULL data set is scored) |
| 2 |
• | QC1DB |
none |
|
pixels |
none | |
22 |
qc_xshift_ur |
this |
last_yr |
all
|
J-band distortion: upper right quadrant of detector [pixels] |
| 2 |
• | QC1DB |
none |
|
pixels |
none | |
17 |
qc_xshift_ur |
this |
last_yr |
all
|
H-band distortion: upper right quadrant of detector [pixels] |
| 2 |
• | QC1DB |
none |
|
pixels |
none | |
27 |
qc_xshift_ur |
this |
last_yr |
all
|
K-band distortion: upper right quadrant of detector [pixels] |
| 2 |
• | QC1DB |
none |
|
pixels |
none | |
25 |
qc_xshift_ur |
this |
last_yr |
all
|
H+K-band distortion: upper right quadrant of detector [pixels] |
|
| 3 |
o | QC1DB |
MEDIAN |
10.2 |
pixels |
VAL | 2,16 |
91 |
qc_xshift_cc |
this |
last_yr |
all
|
distortion in center of the detector for ALL bands [pixels]
(this FULL data set is scored) |
| 3 |
• | QC1DB |
none |
|
pixels |
none | |
22 |
qc_xshift_cc |
this |
last_yr |
all
|
J-band distortion: center of detector [pixels] |
| 3 |
• | QC1DB |
none |
|
pixels |
none | |
17 |
qc_xshift_cc |
this |
last_yr |
all
|
H-band distortion: center of detector [pixels] |
| 3 |
• | QC1DB |
none |
|
pixels |
none | |
27 |
qc_xshift_cc |
this |
last_yr |
all
|
K-band distortion: center of detector [pixels] |
| 3 |
• | QC1DB |
none |
|
pixels |
none | |
25 |
qc_xshift_cc |
this |
last_yr |
all
|
H+K-band distortion: center of detector [pixels] |
|
| 4 |
o | QC1DB |
MEDIAN |
5.39 |
pixels |
VAL | -2,13 |
91 |
qc_xshift_ll |
this |
last_yr |
all
|
distortion in lower left quadrant of detector for ALL bands [pixels]
(this FULL data set is scored) |
| 4 |
• | QC1DB |
none |
|
pixels |
none | |
22 |
qc_xshift_ll |
this |
last_yr |
all
|
J-band distortion: lower left quadrant of detector [pixels] |
| 4 |
• | QC1DB |
none |
|
pixels |
none | |
17 |
qc_xshift_ll |
this |
last_yr |
all
|
H-band distortion: lower left quadrant of detector [pixels] |
| 4 |
• | QC1DB |
none |
|
pixels |
none | |
27 |
qc_xshift_ll |
this |
last_yr |
all
|
K-band distortion: lower left quadrant of detector [pixels] |
| 4 |
• | QC1DB |
none |
|
pixels |
none | |
25 |
qc_xshift_ll |
this |
last_yr |
all
|
H+K-band distortion: lower left quadrant of detector [pixels] |
|
| 5 |
o | QC1DB |
MEDIAN |
16 |
pixels |
VAL | 10.0,23.0 |
91 |
qc_xshift_lr |
this |
last_yr |
all
|
distortion in lower right quadrant of detector for ALL bands [pixels]
(this FULL data set is scored) |
| 5 |
• | QC1DB |
none |
|
pixels |
none | |
22 |
qc_xshift_lr |
this |
last_yr |
all
|
J-band distortion: lower right quadrant of detector [pixels] |
| 5 |
• | QC1DB |
none |
|
pixels |
none | |
17 |
qc_xshift_lr |
this |
last_yr |
all
|
H-band distortion: lower right quadrant of detector [pixels] |
| 5 |
• | QC1DB |
none |
|
pixels |
none | |
27 |
qc_xshift_lr |
this |
last_yr |
all
|
K-band distortion: lower right quadrant of detector [pixels] |
| 5 |
• | QC1DB |
none |
|
pixels |
none | |
25 |
qc_xshift_lr |
this |
last_yr |
all
|
H+K-band distortion: lower right quadrant of detector [pixels] |
|
| |
|
*Data sources: QC1DB: QC1 database; LOCAL: local data source
|
