A series of solar spectra has been taken in the night 2001-02-08/09 with UVES
at the 8m Kueyen telescope (UT2), between 03:19 and 03:36 UT. They have been
obtained with the Moon illuminating the slit. The slit width has been set to
0.3 arcs. Four different settings (using the dichroic filters #1 and #2) have
been used, covering the whole UV/optical/near-IR range accessible to UVES (3,100
A - 10,200 A). The CCDs have not been binned. Airmass was 1.6-1.7 during the
exposures.
| setting* |
range (A) |
number of spectra |
exposure time (secs) |
resolving power R** |
| 3460 DI1 1x1 |
3100 - 3800 |
2 |
60 |
85,000 |
| 4370 DI2 1x1 |
3700 - 4900 |
4 |
30 |
| 5800 DI1 1x1 |
4750 - 5700,
5800 - 6700 |
4 |
15 |
115,000 (shorter range)
100,000 (longer range)
|
| 8600 DI2 1x1 |
6600 - 8400,
8650 - 10200 |
4 |
20 |
|
* central wavelength, dichroic filter, binning
** as measured from arc lamp exposures of that period
Reduction
The spectra fill the slit continuously, very much like a flat field lamp. Each
spectrum has been reduced with the UVES
pipeline. The data have been de-biased, flat-fielded, re-aligned row-by-row
('2D extraction', see below) so that the tilted echelle orders become aligned
with the X axis, and then wavelength calibrated.
Since there is no real spatial information, this pipeline product has then
been collapsed in Y direction. Also all exposures per setting have been co-added.
The resulting 6 spectra (2 blue ones and 2x2 red ones) have then been merged
into the final solar spectrum.
2D Extraction
Neither optimal nor average extraction give useful results here. The 2D extraction
mode of the UVES pipeline has been used instead.
Both optimal and average extraction depend on an unresolved
continuum which is used to find the signal and then extract it (either using
a Gaussian fit or by averaging the signal in the object window). Optimum extraction
simply fails since no signal is found (the solar spectrum is taken by the pipeline
as background signal). Average extraction also fails since the signal and the
sky are identical and the net spectrum is zero.
The 2D extraction uses the order table to define the extraction slit which
is then used to extract the flux binwise (i.e. follow the inclined echelle orders
while preserving the spatial information along the slit). The final product
of the pipeline then is a 2D reduced spectrum where one dimension is wavelength
and the other one the Y coordinate in cross-dispersion direction (along the
slit).
Some remarks
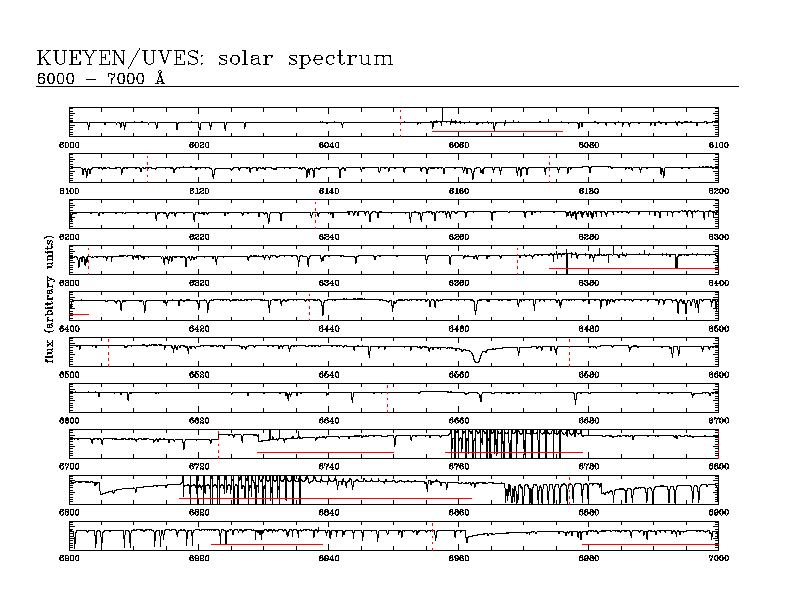
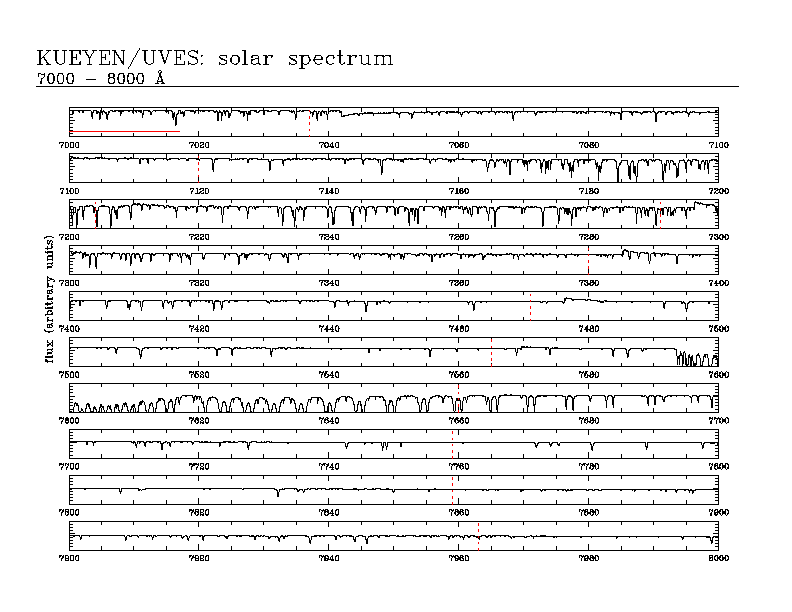
The echelle orders are merged in a rather crude way by the pipeline
(simply by averaging overlapping
regions). In some cases sudden steps in the spectral slope appear due to this
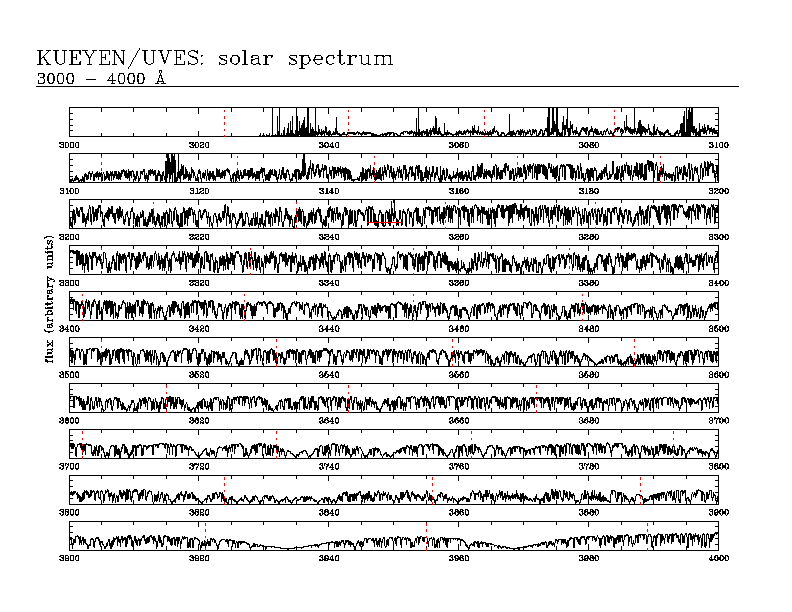
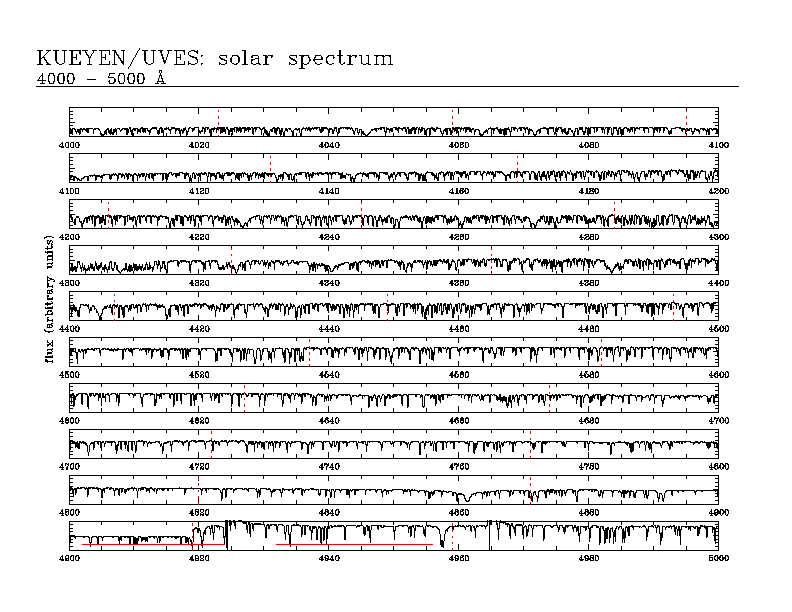
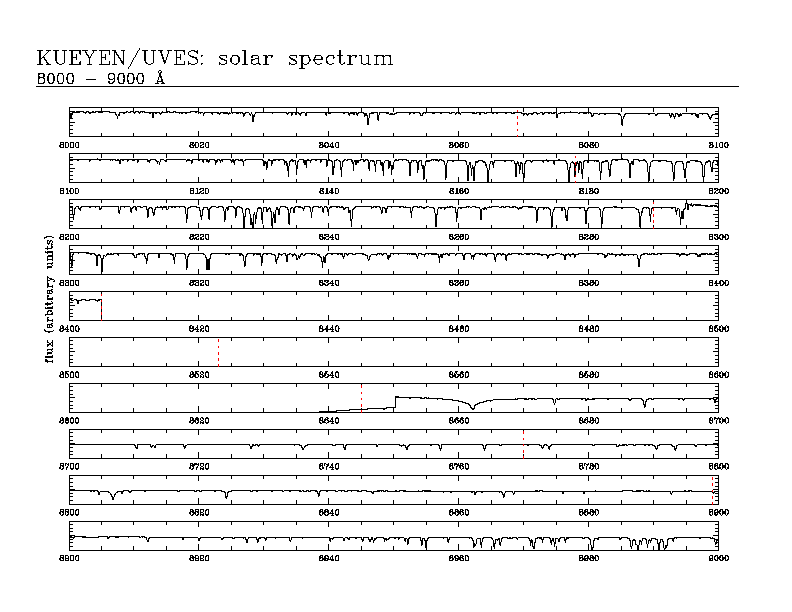
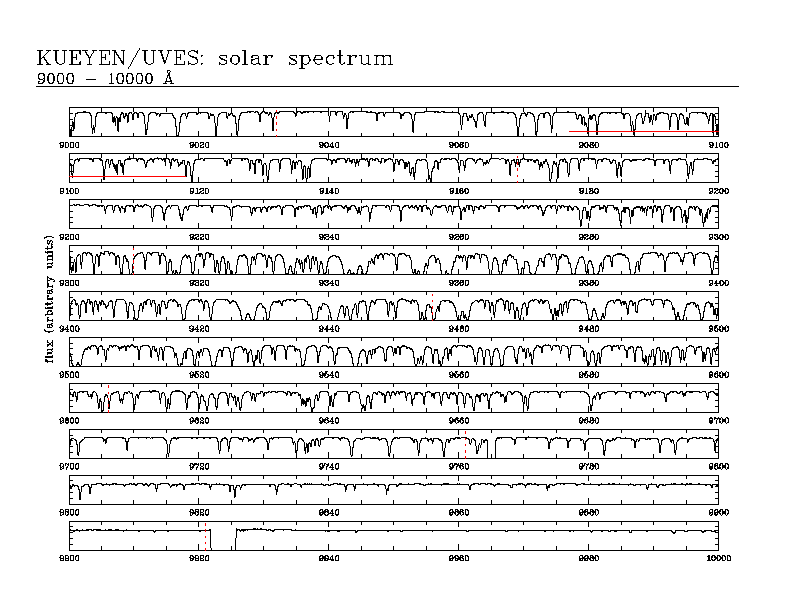
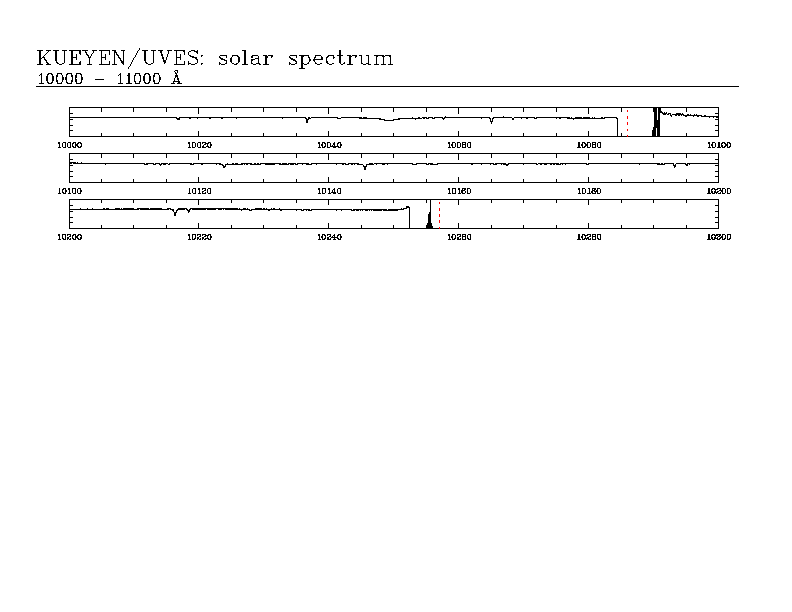
procedure. The nominal start wavelength of each order is marked in the plots by
the vertical broken red line.
Generally the continuum slope in the data has been modified only by the flattening
process which corrects for the blaze function. No additional rectification has
been applied.
No attempt has been made to remove telluric absorption lines from the
spectra.
Spectral gaps occur at 5710 - 5820 A and 8405 - 8650 A, due to incomplete overlap
of the spectral range of the gratings. Above 9760 A the orders do not overlap
anymore.
There are some problems with the extracted spectra due to imperfect flat fielding.
These show in some cases outliers (caused by bad columns) which divide into
the spectra and appear, in the non-averaged (2D) format, as inclined step function.
In the collapsed version this artefact is correspondingly spread in wavelength
space. In most cases the effect is barely noticable (faint artificial 'emission'),
but in a few cases the spectrum is strongly affected (especally in the 6700/6800
A region). In any case, the ranges are marked in the plots by a horizontal red
bar. Find the table of wavelength ranges affected here.
Plots
These plots show the solar spectrum in bins of 1000 A width.
Spectrum
The complete UVES solar spectrum can be downloaded as FITS file here
(4.0 MB FITS file; click on right mouse button, "Save Link as ..."). Its format is one-dimensional, with X coordinate in Angstroems.
Uniform step size is 0.0124862 A.

