Plot
? |
Symb
? |
Source
* |
Average ? |
Thresholds ? |
N_
data |
QC1
parameter |
Data
downloads |
Remarks |
| method |
value |
unit |
method |
value |
| 1 |
• | QC1DB |
none |
|
NONE |
none | |
104 |
resol_med |
this |
last_yr |
all
|
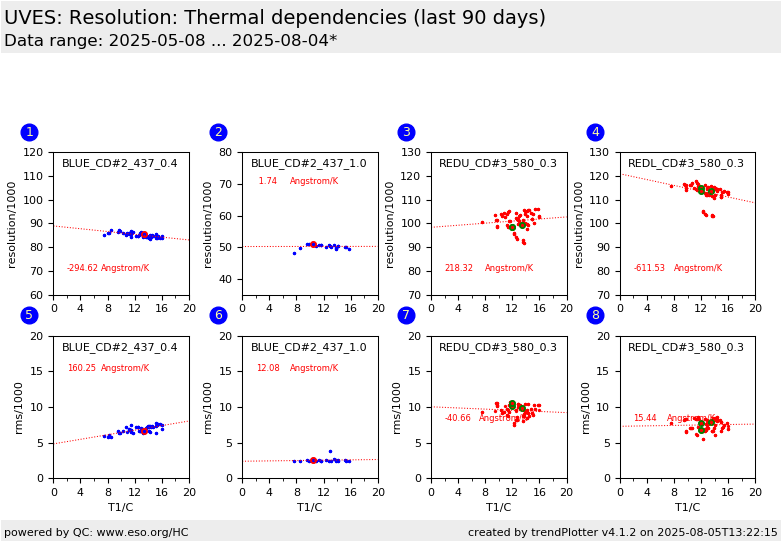
Resolution vs. T4 for CD#2, BLUE 437, 1x1, 0.4 arcs slit |
| 2 |
• | QC1DB |
none |
|
NONE |
none | |
42 |
resol_med |
this |
last_yr |
all
|
Resolution vs. T4 for CD#2, BLUE 437, 1x1, 1 arcs slit |
| 3 |
• | QC1DB |
none |
|
NONE |
none | |
120 |
resol_med |
this |
last_yr |
all
|
Resolution vs. T4 , CHIPU 580 1x1 data |
| 4 |
• | QC1DB |
none |
|
NONE |
none | |
119 |
resol_med |
this |
last_yr |
all
|
Resolution vs. T4 , CHIPL 580 1x1 data |
| 5 |
• | QC1DB |
none |
|
NONE |
none | |
101 |
resol_rms |
this |
last_yr |
all
|
Resolution rms vs. T4 for CD#2, BLUE 437, 1x1, 0.4 arcs slit |
| 6 |
• | QC1DB |
none |
|
NONE |
none | |
42 |
resol_rms |
this |
last_yr |
all
|
Resolution rms vs. T4 for CD#2, BLUE 437, 1x1, 1 arcs slit |
| 7 |
• | QC1DB |
none |
|
NONE |
none | |
110 |
resol_rms |
this |
last_yr |
all
|
Resolution rms vs. T4 , CHIPU 580 1x1 data |
| 8 |
• | QC1DB |
none |
|
NONE |
none | |
116 |
resol_rms |
this |
last_yr |
all
|
Resolution rms vs. T4 , CHIPL 580 1x1 data |
| |
|
*Data sources: QC1DB: QC1 database; LOCAL: local data source
|
Plot 1
scores: not implemented
| | data source: | uves_wave
(QC1 database) |
| dataset: | resol_med | • |
| average: | none |
| thresholds: | none |
| N_data plotted: | 104 |
| [click plot for closeup] |
Plot 2
scores: not implemented
| | data source: | uves_wave
(QC1 database) |
| dataset: | resol_med | • |
| average: | none |
| thresholds: | none |
| N_data plotted: | 42 |
| [click plot for closeup] |
Plot 3
scores: not implemented
| | data source: | uves_wave
(QC1 database) |
| dataset: | resol_med | • |
| average: | none |
| thresholds: | none |
| N_data plotted: | 120 |
| [click plot for closeup] |
Plot 4
scores: not implemented
| | data source: | uves_wave
(QC1 database) |
| dataset: | resol_med | • |
| average: | none |
| thresholds: | none |
| N_data plotted: | 119 |
| [click plot for closeup] |
Plot 5
scores: not implemented
| | data source: | uves_wave
(QC1 database) |
| dataset: | resol_rms | • |
| average: | none |
| thresholds: | none |
| N_data plotted: | 101 |
| [click plot for closeup] |
Plot 6
scores: not implemented
| | data source: | uves_wave
(QC1 database) |
| dataset: | resol_rms | • |
| average: | none |
| thresholds: | none |
| N_data plotted: | 42 |
| [click plot for closeup] |
Plot 7
scores: not implemented
| | data source: | uves_wave
(QC1 database) |
| dataset: | resol_rms | • |
| average: | none |
| thresholds: | none |
| N_data plotted: | 110 |
| [click plot for closeup] |
Plot 8
scores: not implemented
| | data source: | uves_wave
(QC1 database) |
| dataset: | resol_rms | • |
| average: | none |
| thresholds: | none |
| N_data plotted: | 116 |
| [click plot for closeup] |
This is the trending report for monitoring the dependencies between the
temperature and UVES Resolution based on QC
parameters derived from wavelength calibration frames (WAVE_ECH).
It trends the measured resolution in the Health
Check calibrations which are taken in BLUE (437nm) and RED
(580nm) settingis.
The resolutions (from the user manual) are :
SLITW R_blue R_red(L) old_R_red(U)
#2.1 20000 20000 19000
#2.0 22000 22000 20900
#1.50 31000 31000 29450
#1.40 32000 32000 30400
#1.30 34000 34000 32300
#1.20 37000 37000 35150
#1.10 39000 39000 37050
#1.00 41000 42000 39900
#0.90 44000 46000 43700
#0.80 50000 53000 50350
#0.70 54000 60000 57000
#0.60 59000 68000 64600
#0.50 65000 78000 74100
#0.40 71000 91000 86450
#0.30 78000 108000 102600
#0.20 82000 129000 122550
General information
Click on any of the plots to see a close-up version.
The latest date is indicated on top of the plot.
If configured,
- data points belonging to the latest date are specially marked
- statistical averages are indicated by a solid line, and thresholds by broken lines
- outliers are marked by a red asterisk. They are defined as data points outside the
threshold lines
- "aliens" (= data points outside the plot Y limits) are marked by a red arrow (↑ or ↓)
- you can download the data for each parameter set if the 'Data downloads' link shows up
|
