Plot
? |
Symb
? |
Source
* |
Average ? |
Thresholds ? |
N_
data |
QC1
parameter |
Data
downloads |
Remarks |
| method |
value |
unit |
method |
value |
| 1 |
• | QC1DB |
FIXED |
92.5 |
NONE |
VAL | 85,103 |
90 |
resol_med |
this |
last_yr |
all
|
Average resolving power, from ARCLAMP data BLUE 437.0, 1x1, 0.4arcs slit |
| 2 |
• | QC1DB |
MEDIAN |
17.5 |
ADU/s |
VAL | 15.8,21.8 |
90 |
int_avg |
this |
last_yr |
all
|
Average intensity of selected lines, same data |
| 3 |
• | QC1DB |
FIXED |
1.18e+03 |
NONE |
VAL | 1100,1600 |
90 |
nlin_tot |
this |
last_yr |
all
|
Number of lines found, same data |
| 4 |
• | QC1DB |
FIXED |
7.5 |
NONE |
VAL | 0,9.55 |
90 |
resol_rms |
this |
last_yr |
all
|
RMS of resolving power, same data |
| 5 |
• | QC1DB |
FIXED |
50 |
NONE |
VAL | 40,60 |
90 |
nlin_int |
this |
last_yr |
all
|
Number of lines used in Integrated Average Intensity, same data |
| 6 |
• | QC1DB |
MEDIAN |
633 |
NONE |
VAL | 550,700 |
90 |
nlin_sol |
this |
last_yr |
all
|
Number of lines actually used in final solution, same data |
| |
|
*Data sources: QC1DB: QC1 database; LOCAL: local data source
|
Plot 1
scores:  8| 8|
| | data source: | uves_wave
(QC1 database) |
| dataset: | resol_med | • |
| fixed average: | 92.5 | NONE |
| fixed thresholds: | 85...103 | NONE |
| N_data plotted: | 90 |
| [click plot for closeup] |
Plot 2
scores: 8|
| | data source: | uves_wave
(QC1 database) |
| dataset: | int_avg | • |
| median: | 17.5 | ADU/s |
| fixed thresholds: | 15.8...21.8 | ADU/s |
| N_data plotted: | 90 |
| [click plot for closeup] |
Plot 3
scores: not implemented
| | data source: | uves_wave
(QC1 database) |
| dataset: | nlin_tot | • |
| fixed average: | 1.18e+03 | NONE |
| fixed thresholds: | 1100...1600 | NONE |
| N_data plotted: | 90 |
| [click plot for closeup] |
Plot 4
scores: 8|
| | data source: | uves_wave
(QC1 database) |
| dataset: | resol_rms | • |
| fixed average: | 7.5 | NONE |
| fixed thresholds: | 0...9.55 | NONE |
| N_data plotted: | 90 |
| [click plot for closeup] |
Plot 5
scores: 8|
| | data source: | uves_wave
(QC1 database) |
| dataset: | nlin_int | • |
| fixed average: | 50 | NONE |
| fixed thresholds: | 40...60 | NONE |
| N_data plotted: | 90 |
| [click plot for closeup] |
Plot 6
scores: 8|
| | data source: | uves_wave
(QC1 database) |
| dataset: | nlin_sol | • |
| median: | 633 | NONE |
| fixed thresholds: | 550...700 | NONE |
| N_data plotted: | 90 |
| [click plot for closeup] |
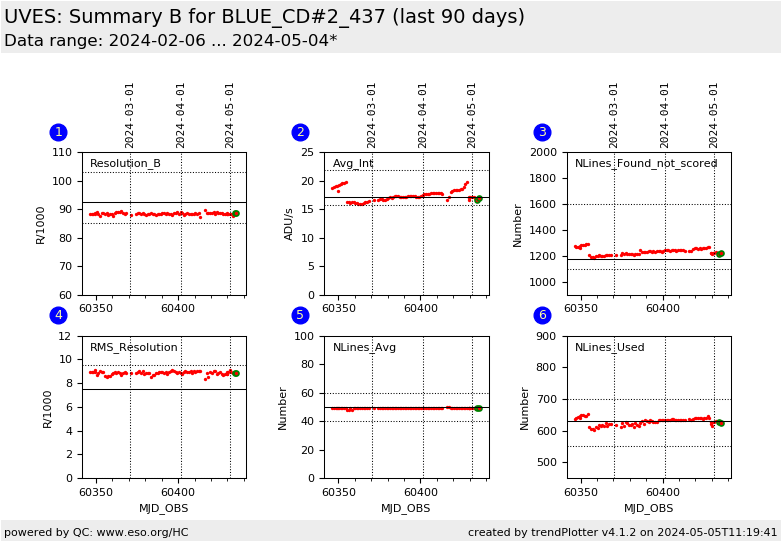
This is the trending report for monitoring UVES Resolution based on QC
parameters derived from Wavelength Calibration frames.
This report presents a second set of detailed parameters of the
wavelength solution for BLUE 437, 1x1 binning data, 2pts/625kHz/lg
readout mode, 0.4 arcsec slit-width setup.
The individual plots describe:
- The average of the resolution values measured for each line
included in the final selection, (this is a repeat of the data
presented in the
RESOLUTION overview report.
For this plot the value of the lower threshold is set to the value
given in the user manual.
- Average ntensity of a subset of lines scaled to unit exposure time
- The total number of lines found in the frame. The PL automatically adjusts the
detection threshold until the number of lines found falls within the
--minlines and --maxlines parameters of the recipe, by default 1100
and 1600 for the BLUE chip
- The RMS of the resolution values measured for each line included in the final selection
- The number of lines included in the calculation of the average of the intensity
- The number of lines included in the final wavelength calibration
solution. The selection is made in a two step process, first line with
residuals larger than --tolerance (default 0.6 pix) are discarded,
then the remaining list is further refined with kappa-sigma clipping
controlled by the --kappa (default 4.0 sigma) recipe command line
option.
SLITW R_blue R_red(L) old_R_red(U)
#2.1 20000 20000 19000
#2.0 22000 22000 20900
#1.50 31000 31000 29450
#1.40 32000 32000 30400
#1.30 34000 34000 32300
#1.20 37000 37000 35150
#1.10 39000 39000 37050
#1.00 41000 42000 39900
#0.90 44000 46000 43700
#0.80 50000 53000 50350
#0.70 54000 60000 57000
#0.60 59000 68000 64600
#0.50 65000 78000 74100
#0.40 71000 91000 86450
#0.30 78000 108000 102600
#0.20 82000 129000 122550
Find more information about UVES Wavelength Solution monitoring here.
General information
Click on any of the plots to see a close-up version.
The latest date is indicated on top of the plot.
If configured,
- data points belonging to the latest date are specially marked
- statistical averages are indicated by a solid line, and thresholds by broken lines
- outliers are marked by a red asterisk. They are defined as data points outside the
threshold lines
- "aliens" (= data points outside the plot Y limits) are marked by a red arrow (↑ or ↓)
- you can download the data for each parameter set if the 'Data downloads' link shows up
|
