Plot
? |
Symb
? |
Source
* |
Average ? |
Thresholds ? |
N_
data |
QC1
parameter |
Data
downloads |
Remarks |
| method |
value |
unit |
method |
value |
| 1 |
• | QC1DB |
MEDIAN |
0.0735 |
Efficiency (frac.) |
VAL | 0.054,0.15 |
28 |
max_effic |
this |
last_yr |
all
|
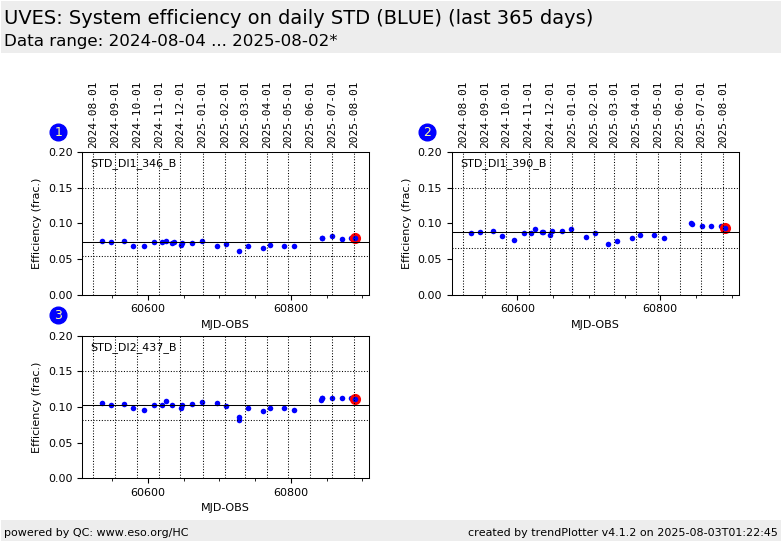
Efficiency for STD at central wavelength:
DI1, 346 BLUE |
| 2 |
• | QC1DB |
MEDIAN |
0.0875 |
Efficiency (frac.) |
VAL | 0.065,0.15 |
28 |
max_effic |
this |
last_yr |
all
|
DI1, 390 BLUE |
| 3 |
• | QC1DB |
MEDIAN |
0.103 |
Efficiency (frac.) |
VAL | 0.081,0.15 |
29 |
max_effic |
this |
last_yr |
all
|
DI2, 437 BLUE |
| |
|
*Data sources: QC1DB: QC1 database; LOCAL: local data source
|
Plot 1
scores: not implemented
| | data source: | uves_std
(QC1 database) |
| dataset: | max_effic | • |
| median: | 0.0735 | Efficiency (frac.) |
| fixed thresholds: | 0.054...0.15 | Efficiency (frac.) |
| N_data plotted: | 28 |
| [click plot for closeup] |
Plot 2
scores: not implemented
| | data source: | uves_std
(QC1 database) |
| dataset: | max_effic | • |
| median: | 0.0875 | Efficiency (frac.) |
| fixed thresholds: | 0.065...0.15 | Efficiency (frac.) |
| N_data plotted: | 28 |
| [click plot for closeup] |
Plot 3
scores: not implemented
| | data source: | uves_std
(QC1 database) |
| dataset: | max_effic | • |
| median: | 0.103 | Efficiency (frac.) |
| fixed thresholds: | 0.081...0.15 | Efficiency (frac.) |
| N_data plotted: | 29 |
| [click plot for closeup] |
This is the trending report for UVES QC parameters derived from
standard star observations.
UVES flux standard stars are observed for two purposes: for flux calibration, with
a frequency of approximately once per 3 days during nighttime, and for
system efficiency monitoring
approximately once per 14 days. In both cases
observations are made in 3 dichroic settings: DI1 346+580, DI1
390+564 and DIC#2 437+860. The CCD readout mode is always
225kHz,1x1,low. Observations are made with a 5 or a 10 arcsec
slit. The measured efficiency is then the maximum efficiency at
the center of an order closest to the central wavelength of the
wavelength setting.
The individual plots describe
the measured efficiency for the three wavelength settings 346, 390 and 437
nm.
These reports are not scored since an outlier might be due to bad atmospheric
conditions rather than indicate an issue with the instrument. Interpretation
of the reports requires knowledge of the actual conditions during the night.
Find more information about UVES Efficiency monitoring here.
General information
Click on any of the plots to see a close-up version.
The latest date is indicated on top of the plot.
If configured,
- data points belonging to the latest date are specially marked
- statistical averages are indicated by a solid line, and thresholds by broken lines
- outliers are marked by a red asterisk. They are defined as data points outside the
threshold lines
- "aliens" (= data points outside the plot Y limits) are marked by a red arrow (↑ or ↓)
- you can download the data for each parameter set if the 'Data downloads' link shows up
|
