science recipes
| HOME | INDEX | SEARCH | HELP | NEWS |
| VIMOS pipeline: science recipes |
|||||
|
|
Typical observation and reduction problems are listed here.
DPR CATG = SCIENCE
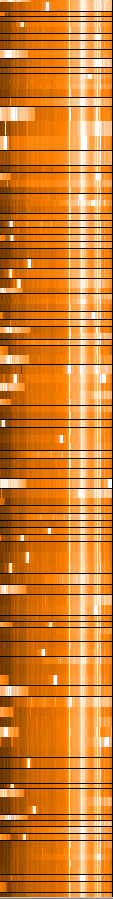
Recipe The pipeline recipes vmimobsstare and vmimobsjitter do bias subtraction with overscan removal, flat-fielding and removal of cosmic raysl. Images taken in UBVRI filters are also photometrically calibrated. Combination of images taken in jittered mode is pipeline-supported but not applied for data reduction that is used for producing data packages. Photometric calibration consists of writing in the header of the reduced image the zeropoint keyword (in ADU/sec): "HIERARCH ESO PRO MAG ZERO", with its RMS: "HIERARCH ESO PRO MAGZERO RMS". The zeropoints are in general obtained every night, but when the night determination is not available the closest in time zeropoint is used. For the zeropoints determination see the zeropoint page . The pipeline recipe also converts the header keywords "HIERARCH ESO PRO SKY CCD" containing the sky to CCD transformation into the "WCS" (World-Coordinate-System) format readable by the "Mask-preparation Software" and by Skycat. (The converted keywords are called "COi_j"). The pipeline recipe also computes qc parameters (see below) and writes them in the reduced image header. Recipe for pre-imaging The recipe vmimpreimaging is only used for quick-delivery data, and for this purpose standard (not the latest) master calibrations are used. Pre-imaging is taken in stare mode only. The pipeline recipe vmimpreimaging does bias subtraction with overscan removal, flat-fielding and converts the header keywords "HIERARCH ESO PRO SKY CCD" into the "COi_j" keywords readable by the "Mask-preparation Software". Photometric calibration is not performed and QC parameters are not computed. Products
* coded as HIERARCH.ESO.PRO.CATG in the fits header QC checks As part of the quality control the following parameters are computed by the pipeline imaging recipe and their value are stored in the header of the reduced image. More information on the qc parameters can be found on the QC pages.
Image quality is computed as the mode of FWHM of all the objects in frame classified as stars by SExtractor, when at least 10 stars are found. Error on image quality is the sigma of FWHM of the objects classified as stars. It is computed iteractively, excluding from the distribution outliers at more than 3 sigma. Sky background level is estimated by computing the median pixel value in 100 regions of the frame each of 160x180 pixels, the mean of the 10 lowest values, divided by the exposure time is the estimate of the sky background in (ADU/px/sec). Error on sky background level is the rms of the 10 lower values selected for the background level estimation. Limiting magnitude in frame is computed as the position of the most populated bin of the star magnitudes histogram. Binsizes from 0.1 up to 1 magnitudes are tried until the most populated bin contains at least 20 stars. If the 20 stars level for the highest bin is never reached, the limiting magnitude is set to 0. Error on limiting magnitude is the value of the binsize of the histogram used to determine the limiting magnitude. DPR CATG = SCIENCE,
Recipe vmmosscience The pipeline recipe vmmosscience is available since pipeline version 2.3.9. It expects as input calibration products the output of the recipe vmmoscalib. It is used for data reduction since August 2010. The recipe vmmosscience applies bias subtraction with overscan removal and flat-fielding. Slit spectra are remapped in order to eliminate optical distortion, wavelength-calibrated using the input wavelength calibration and sky lines, and subtracted from sky background. Objects are extracted using an optimal extraction algorithm (K. Horne1986, PASP 98, 609). If more than one scientific exposure is specified as input then each frame is processed as indicated above but all frames are aligned to the first one and stacked before object extraction. MOS masks can be constructed so that they contain multiple layers of slits along the dispersion direction (so called multiplexing). This feature can be used for LR and MR grisms. The recipe vmmosscience detects the number of multiplex layers present in the input and creates output files which are multi-extension fits files (MEFs). The number of extensions is equal to the number of multiplex layers (up to 4 for LR grisms and 2 for MR). If multiplexing is not used then fits files without extensions are created. This strategy is necessary because spectra from two multiplex layers can overlap; MEFs allow to clearly distinguish them. Products
* coded as HIERARCH.ESO.PRO.CATG in the fits header The product OBJECT_SCI_TABLE contains slit and object positions:
Example product images
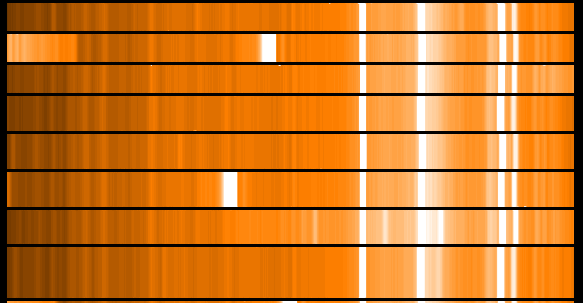
Recipes vmmosobsstare and vmmosobsjitter These recipes have been used for data reduction of MOS science until May 2010. They are still available in the pipeline delivery. The pipeline recipe vmmosobsstare and vmmosobsjitter apply bias subtraction with overscan removal. Flat-field correction is available but not executed during standard reduction for PI data packages. Observations in the red part of the spectrum show strong fringing whereas in the blue reflections are present. Both effects can cause artificial features in science frames during flat-fielding. The shift in the wavelength direction with respect to skylines is computed and applied to correct for flexures (the skylines used are listed in the header of the input wavelength dispersion solution table under the keywords "HIERARCH ESO PRO SKY WLENi"). The objects in slits are detected, the 2-dimensional slit extraction is done using the distortion models and the inverse dispersion solution read in the wavelength solution table. The median sky level is subtracted and two images containing 2-dimensional object spectra and sky spectra are produced. These images are resampled to a constant wavelength interval as listed in the header keyword CDELT1 (5.27 A/pix for the LR_blue grism), and the wavelength corresponding to the first pixel is listed in the header keyword CRVAL1 (3700 A for LR_blue). Then, in case of jittered data, the 2-dimensional products are stacked. Finally the 1-dimensional optimal extraction is applied (K. Horne1986, PASP 98, 609) and the result for each slit is stored in one row of the product image. Products
* coded as HIERARCH.ESO.PRO.CATG in the fits header The product WINDOW_TABLE refers to the 2-dimensional extracted spectra (MOS_SCIENCE_EXTRACTED and MOS_SCIENCE_SKY) and contains the following columns:
The product OBJECT_TABLE refers to the 1-dimensional extracted spectra MOS_SCIENCE_REDUCED and contains the following columns:
DPR CATG = SCIENCE,
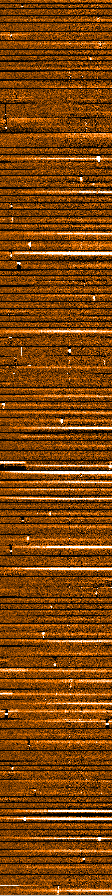
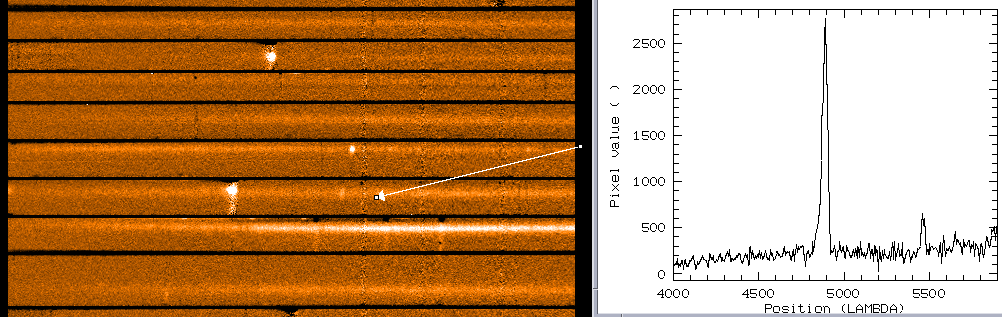
Recipe IFU The pipeline recipe vmifuscience is used to reduce a single IFU science exposure. In addition to a raw science exposure the recipe requires a master bias, an inverse dispersion solution file, a fiber relative transmission file, and a file containing information on the tracing of the fibers. The last three files are obtained with the recipe vmifucalib using arc-lamps and flat-field frames which belong to the night-time calibrations associated to the science exposure. The recipe starts with bias subtraction. Then, it refines the input tracing file using the brightest fiber of the science exposure and refines the input inverse dispersion solution file using the position of some identified sky-lines. The spectra are then extracted, wavelength calibrated and resampled to a constant wavelength step (written in the keyword CDELT1). The extracted spectra are also corrected for the relative differences in fiber transmission (using the input relative transmission file) and finally stored in the output image in the usual order: sucessively from pseudo-slit1 to pseudo-slit4 counting fibers from left to right. Flat-fielding and fringing correction are not executed. The extracted fiber spectra image is then used together with the appropriate IFU table to reconstruct the image of the field of view. The extracted spectra are integrated in a predefined wavelength range, chosen where the spectra are brighter and excluding zero order contaminations, and the value obtained are stored in the corresponding positions on the IFU head. Products
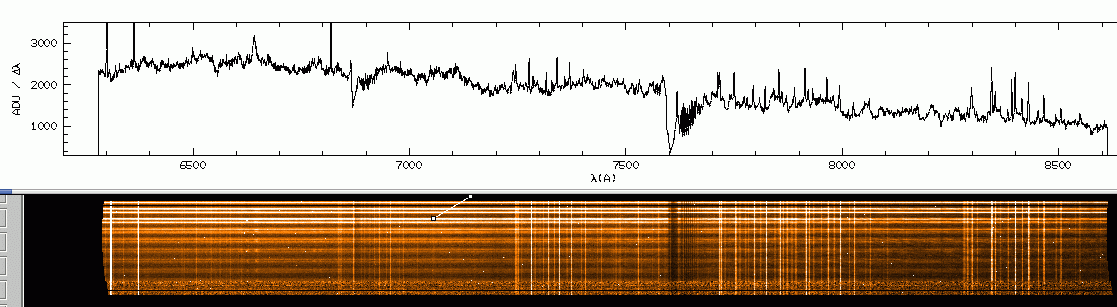
* coded as HIERARCH.ESO.PRO.CATG in the fits header A product image IFU_SCIENCE_REDUCED is shown below, obtained with the raw image shown above. The extracted fibre spectra are 400 and the spectrum of the fiber 352 is plotted on the top. The spectra are resampled to the constant wavelength interval listed in the header keyword CDELT1. CDELT1 is 0.58 A/pix in this image taken with the HR_red grism. The spectral signal is given in ADU per wavelength interval, then, to have the signal per Angstrom one should divide the spectrum by CDELT1. Clearly visible are sky emission and absorption lines. The position of some sky emission lines are also used during the QC checks to control the wavelength calibration.
| ||||||||||||||||||||||||||||||||||||||||||||||||||||||||||||||||||||||||||||||||||||||||||||||||||||||||||||||||||||||||||||||||||||||||||||||||||||||||||||||||||||||||||||||||||||||||||||||||||||||||||||||||||||||||||||||||||||||||||||||||||||||||||||||||||||||||||||||||||||||||||||||||||||||||||||||||||||||||||||||||||||||||||||||||||||||||||||||||||||||||||||||||||||||||||||||||||||||||||||||||||||||||||||||
 |
|
||||||||||||||||||||||||||||||||||||||||||||||||||||||||||||||||||||||||||||||||||||||||||||||||||||||||||||||||||||||||||||||||||||||||||||||||||||||||||||||||||||||||||||||||||||||||||||||||||||||||||||||||||||||||||||||||||||||||||||||||||||||||||||||||||||||||||||||||||||||||||||||||||||||||||||||||||||||||||||||||||||||||||||||||||||||||||||||||||||||||||||||||||||||||||||||||||||||||||||||||||||||||||||||
![[imgsci.gif 11K]](../img/imgsci.gif)
![[mosscirawLR_blue.gif 14K]](../img/mosscirawLR_blue.gif)
![[ifusciraw.gif 14K]](../img/ifusciraw.gif)