|
|
 |
| |
| QC
PLOTS |
| |
CURRENT |
HISTORY |
| MOS
efficiency |
 |
 |
| QC1
database (advanced users): browse
| plot
|
Click on CURRENT
to see the current trending (Health Check).
Click on HISTORY
to see the historical evolution of the trending. |
Spectrophotometric standard stars are observed for all
grisms dependent on the usage of the settings for science. Their purpose
is to monitor the overall instrument efficiency (telescope+instrument+detector)
and to provide a measure of the spectral response. In MOS mode, standard
stars are observed with dedicated masks having eight slits where the standard
star is present in one of them.
Information about response curves and flux calibration
can be found here. MOS observations of standards
can suffer from slit losses. An example is provided here.
| top
Efficiency
from spectro-photometric standard stars |
The VIMOS pipeline extracts the signal of the standard
star in the same way as for science observations. Then, the efficiency
curve is calculated as the ratio of the observed flux (in e-/sec/A) at
airmass one and the catalog flux of the star (converted to the expected
number of electrons). The response is the ratio of the catalog flux to
the observed flux (for airmass one). For the purpose of Quality Control,
the efficiency is resampled at 15 fixed wavelengths from 3700A to 9300A
with 400A step size.
QC1 parameters
| parameter |
QC1
database: table, name |
description |
| MOS efficiency |
vimos_mos_std, efficiency1 |
efficiency (ratio of the detected
number of photons to the real number of photons) at 3700A |
| vimos_mos_std, efficiency2 |
efficiency at 4100A |
| vimos_mos_std, efficiency3 |
efficiency at 4500A |
| vimos_mos_std, efficiency4 |
efficiency at 4900A |
| vimos_mos_std, efficiency5 |
efficiency at 5300A |
| vimos_mos_std, efficiency6 |
efficiency at 5700A |
| vimos_mos_std, efficiency7 |
efficiency at 6100A |
| vimos_mos_std, efficiency8 |
efficiency at 6500A |
| vimos_mos_std, efficiency9 |
efficiency at 6900A |
| vimos_mos_std, efficiency10 |
efficiency at 7300A |
| vimos_mos_std, efficiency11 |
efficiency at 7700A |
| vimos_mos_std, efficiency12 |
efficiency at 8100A |
| vimos_mos_std, efficiency13 |
efficiency at 8500A |
| vimos_mos_std, efficiency14 |
efficiency at 8900A |
| vimos_mos_std, efficiency15 |
efficiency at 9300A |
Trending
For each grism, one QC1 efficiency parameter is monitored
over time as a measure for the time dependency of the overall efficiency
in each setting. The following associations are used:
| grism name |
QC1 parameter name |
wavelength |
| LR_blue |
efficiency4 |
4900A |
| LR_red |
efficiency9 |
6900A |
| MR |
efficiency8 |
6500A |
| HR_blue |
efficiency6 |
5700A |
| HR_orange |
efficiency7 |
6100A |
| HR_red |
efficiency9 |
6900A |
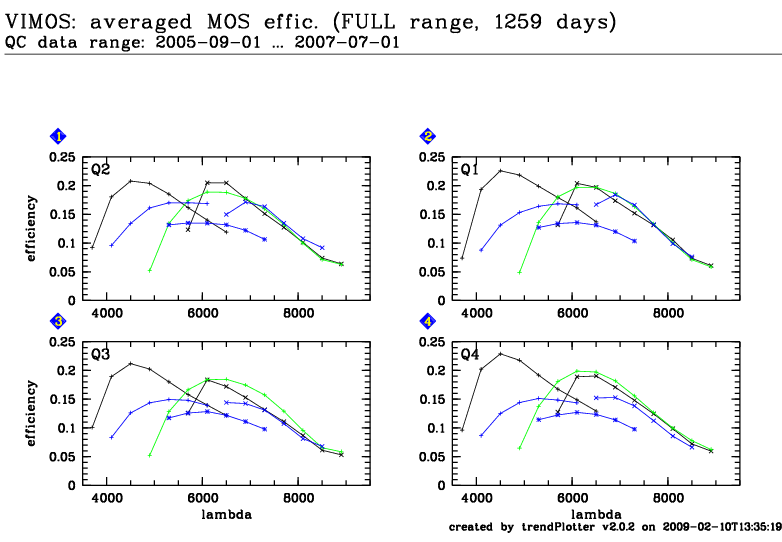
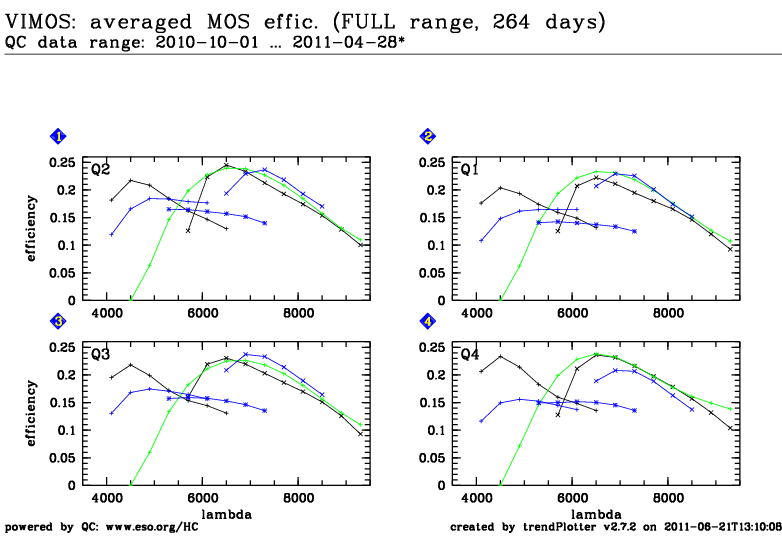
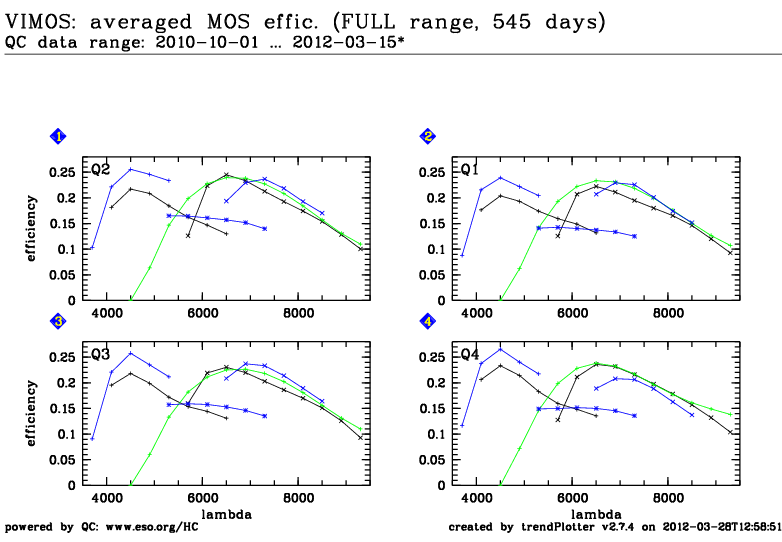
In addition to the trending over time, overview
plots showing the spectral distribution of the efficiency for all wavelengths
are also available.
History
| date |
event |
| 2010-07 |
new detectors with increased efficiency in the red |
| 2012-03 |
new HR_blue grism |
|
