mirror sites: PL (internal link) HQ     [?]

Health Check monitor


CAL | HC | refs | QC
HealthCheck Monitor
   HOME | UsersGuide
  sl icon ALL INSTRUMENTS
XSHOOTER:
lamps: arc & flat
Other HC:
QC links:
        [page auto-refreshes after 300 sec]   [stop | on]            [press Ctrl+Shift+R to enforce refresh of scores, dates and news]
XSHOOTER trending system: HEALTH CHECK report
HELP USERS-GUIDE MORE
Last update: 2013-06-19T23:01:14 (UT)
  | now: 2013-06-20T09:54:57 (UT) muc02 QC pipeline: xshoo-2.2.0 (installed 2013-05-06)
same group: flat_IFU slice_rms flat_slit arc_lamp
General news: Click 'scores&comments' to switch to score details, and 'HC plot' to switch back to the graphics.
XSHOOTER news:  
Report news:
DATE*: [?] 2013-06-13
report | NLT
2013-06-14
report | NLT
2013-06-15
report | NLT
2013-06-16
report | NLT
2013-06-17
report | NLT
2013-06-18
report | NLT
2013-06-19
report | NLT
P...
Product quality:
products products products products products products products
  no OPSLOG data  

scores&comments | history ... | plot tutorial ... | contact                 daily/often; important to check     [?]
*Date on this monitor changes at 21:00 UT
Print: Information and research:
- png file - advanced studies: QC1 browser | QC1 plotter
Plot
?
Symb
?
Source
*
OPS?
**
Average ? Thresholds ? N_
data
QC1
parameter
Data
downloads
Remarks
method value unit method value
1 QC1DB no MEDIAN 0.0379 ADU 40%± 0.0151 152 slice_rms this | last_yr | all rms over three slice window counts
2 QC1DB no MEDIAN 0.684 ratio 5%± 0.0342 152 flux_order_ratio this | last_yr | all illumination slope in cross-dispersed direction
3 QC1DB no MEDIAN 0.0116 ADU 40%± 0.00462 152 slice2_rms this | last_yr | all rms over three slice window counts
*Data sources: QC1DB: QC1 database; LOCAL: local text file | **OPS: OPSLOG data are included
Plot 1
scores: 14|
data source:xshooter_flat
(QC1 database)
dataset:slice_rms
median:0.0379ADU
rel. thresholds: ±40%0.0227142...0.0529998ADU
N_data plotted:152
[click on plot for closeup]
Plot 2
scores: 14|
data source:xshooter_flat
(QC1 database)
dataset:flux_order_ratio
median:0.684ratio
rel. thresholds: ±5%0.649951525...0.718367475ratio
N_data plotted:152
[click on plot for closeup]
Plot 3
scores: no current data
data source:xshooter_flat
(QC1 database)
dataset:slice2_rms
median:0.0116ADU
rel. thresholds: ±40%0.006936...0.016184ADU
N_data plotted:152
[click on plot for closeup]
This plot

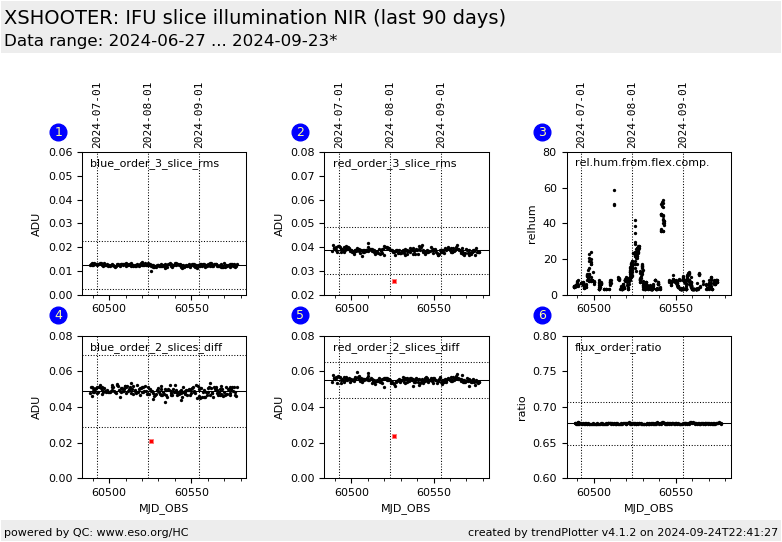
This plot shows two QC parameters measuring the illumination distribution within IFU FLATs.

In a first step the median counts are measured in six dedicated windows:

S1R (slice 1 in red order), S2R (slice 2 in red order) , S3R, S1B (slice 1 in blue order), S2B and S3B.

The QC parameter slice_rm is the rms of the three red order slice counts.

The QC parameter flux_order_ratio is a relative difference between the two flux averages:

fr = ( S1R + S2R + S3R ) / 3.0

fb = ( S1B + S2B + S3B ) / 3.0

flux_order_ratio = (fr - fb) / fr

The windows currently (2012-07-06) in use are (x1, y1, x2, y2)
coords given in pixels of the master flat product:

  • UVB S1R: '1452 1500 1471 1600'
  • UVB S2R: '1477 1500 1493 1600'
  • UVB S3R: '1501 1500 1518 1600'
  • UVB S1B: ' 513 2330 532 2380'
  • UVB S2B: ' 539 2330 557 2380'
  • UVB S3B: ' 564 2330 582 2380'
  • VIS S1R: '1652 2050 1666 2100'
  • VIS S2R: '1674 2050 1684 2100'
  • VIS S3R: '1697 2050 1711 2100'
  • VIS S1B: ' 426 2605 444 2757'
  • VIS S2B: ' 452 2605 470 2757'
  • VIS S3B: ' 477 2605 496 2757'
  • NIR S1R: '622 1133 632 1175'
  • NIR S2R: '638 1133 647 1175'
  • NIR S3R: '655 1133 665 1175'
  • NIR S1B: '125 1080 135 1111'
  • NIR S2B: '143 1080 152 1111'
  • NIR S3B: '160 1080 169 1111'
  • values before format shift from 2013-02-15
  • NIR S1R: '620 1133 630 1175'
  • NIR S2R: '636 1133 646 1175'
  • NIR S3R: '653 1133 663 1175'
  • NIR S1B: '123 1080 133 1111'
  • NIR S2B: '141 1080 150 1111'
  • NIR S3B: '158 1080 167 1111'

2013-03-22: The UVB windows have been made narrower The window sizes and positions are preliminmary and will be reviewed to optimize the sensitivity.

2013-05-27: in the UVB-arm, blue orders are illuminated by the D2 lamp (< 350 nm) and red orders are illuminated by the QTH lamp (> 350 nm).  


General information

Click on any of the plots to see a close-up version. The latest date is indicated on top of the plot, data points belonging to that date are specially marked.

If configured,

  • statistical averages are indicated by a solid line, and thresholds by broken lines
  • outliers are marked by a red asterisk. They are defined as data points outside the threshold lines
  • "aliens" (= data points outside the plot Y limits) are marked by a red arrow ( or )
  • you can download the data for each parameter set if the 'Data downloads' link shows up