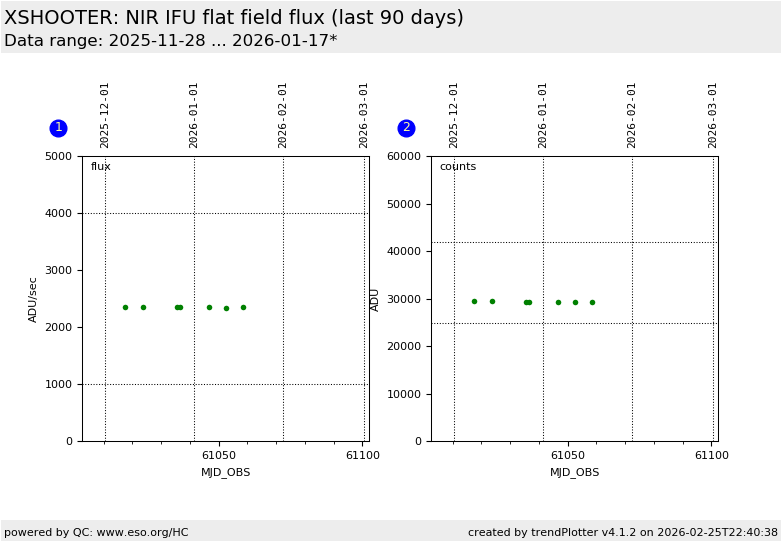
mirror sites: PL HQ

Health Check monitor


CAL | HC | refs | QC
HealthCheck Monitor
   HOME | UsersGuide
  sl icon ALL INSTRUMENTS
XSHOOTER:
lamps: arc & flat
Other HC:
QC links:
        [page auto-refreshes after 300 sec]   [stop | on]            [press Ctrl+R to enforce refresh of scores and dates]
XSHOOTER trending system: HEALTH CHECK report
Last update: 2012-05-25T23:10:20 (UT)
| now: 2012-05-26T09:12:47 (UT)
HELP USERS-GUIDE MORE
same group: flat_IFU flat_slit arc_lamp
General news:
XSHOOTER news: 2112-05-15: Garching pipeline upgraded to v1.4.8
Report news: 2012-05-21: sporadic high flux IFU flats followed up in PPRS-45230
DATE*: [?] 2012-05-19
report | NR
2012-05-20
report | NR
2012-05-21
report | NR
2012-05-22
report | NR
2012-05-23
report | NR
2012-05-24
report | NR
2012-05-25
report | NR
P...
Product quality:
products products products products products products products
  no OPSLOG data  

scores&comments | history ... | plot tutorial ... | contact                 daily/often; important to check     [?]
*Date on this monitor changes at 21:00 UT
Print: Information and research:
- png file - advanced studies: QC1 browser | QC1 plotter
Plot
?
Symb
?
Source
*
OPS?
**
Average ? Thresholds ? N_
data
QC1
parameter
Data
downloads
Remarks
method value unit method value
1 QC1DB no none   ADU/sec VAL800,6000 146 max_flux_norm_1 this | last_yr | all maximum normalized flux in flat for IFU vs. time
2 QC1DB no none   ADU none   146 max_flux_1 this | last_yr | all maximum flux in flat for IFU vs. time
*Data sources: QC1DB: QC1 database; LOCAL: local text file | **OPS: to indicate that OPSLOG data are included
Plot 1
scores: 17|
data source:xshooter_flat
(QC1 database)
dataset:max_flux_norm_1
average:none
fixed thresholds:800.0...6000.0ADU/sec
N_data plotted:146
[click on plot for closeup]
Plot 2
scores: not implemented
data source:xshooter_flat
(QC1 database)
dataset:max_flux_1
average:none
thresholds:none
N_data plotted:146
[click on plot for closeup]
This plot

Here we monitor the flux of the flat field lamp vs. time. For more information see the plot tutorial page.  


General information

Click on any of the plots to see a close-up version. The latest date is indicated on top of the plot, data points belonging to that date are specially marked.

If configured,

  • statistical averages are indicated by a solid line, and thresholds by broken lines
  • outliers are marked by a red asterisk. They are defined as data points outside the threshold lines
  • "aliens" (= data points outside the plot Y limits) are marked by a red arrow ( or )
  • you can download the data for each parameter set if the 'Data downloads' link shows up