Health Check monitor


Agora | CAL | HC | refs | QC
HealthCheck Monitor
    HOME | UsersGuide
XSHOOTER:
detector: bias
Other HC:
QC links:
[page auto-refreshes after 300 sec]            [press Ctrl+R to enforce refresh of scores and dates]
XSHOOTER trending system: HEALTH CHECK plot
Last update: 2010-03-15T13:10:20 (UT)
| now: 2010-03-15T19:32:27 (UT)
HELP USERS-GUIDE MORE
same group: med_master ron_raw ron_master struct_x struct_y
no OPSLOG data
space
 
N_data:
scores&comments... | history ... | plot tutorial ... | contact                 daily/often; important to check     [?] *Date on this monitor changes at 21:00 UT
Print: Information and research: News:
- png file - advanced studies: QC1 browser | QC1 plotter
 
Plot
?
Symb
?
Source
*
OPS?
**
Average ? Thresholds ? N_
data
QC1
parameter
Data
downloads
Remarks
method value unit method value
1 QC1DB no MEDIAN 998.0 ADU VAL980,1020 67 median_master this | last_yr | all 100k/1pt/hg
2 QC1DB no MEDIAN 998.0 ADU VAL980,1020 66 median_master this | last_yr | all 100k/1pt/hg/1x2
3 xQC1DB no MEDIAN 10.02 degree VAL0,20 133 cryo_temp this | last_yr | all Temperature
4 QC1DB no MEDIAN 1003.0 ADU VAL980,1020 66 median_master this | last_yr | all 400k/1pt/lg
5 QC1DB no MEDIAN 1002.0 ADU VAL980,1020 66 median_master this | last_yr | all 400k/1pt/lg/1x2
6 xQC1DB no MEDIAN 10.11 degree VAL0,20 132 cryo_temp this | last_yr | all Temperature
*Data sources: QC1DB: QC1 database; LOCAL: local text file | **OPS: to indicate that OPSLOG data are included
This plot

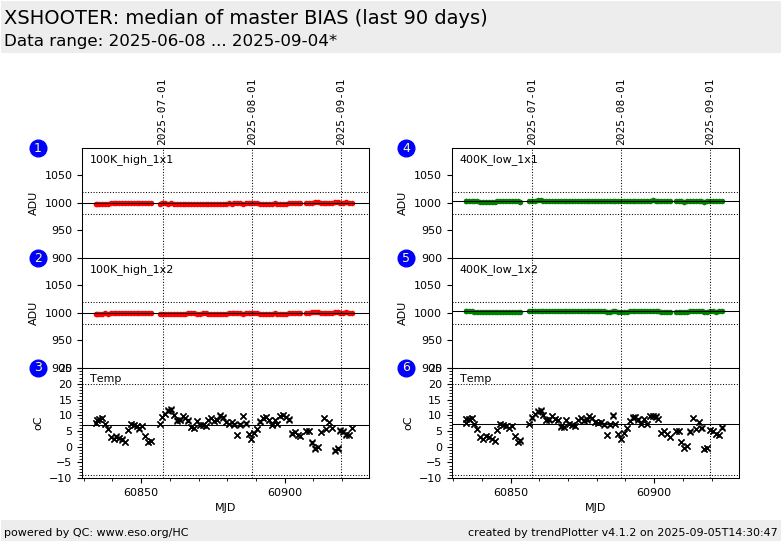
The bias level (in ADU) is evaluated as the median value of all pixels in the master bias.  


General information

Click on any of the plots to see a close-up version. The latest date is indicated on top of the plot, data points belonging to that date are specially marked.

If configured,

  • statistical averages are indicated by a solid line, and thresholds by broken lines
  • outliers are marked by a red asterisk. They are defined as data points outside the threshold lines
  • "aliens" (= data points outside the plot Y limits) are marked by a red arrow ( or )
  • you can download the data for each parameter set if the 'Data downloads' link shows up