mirror sites: PL HQ

Health Check monitor


CAL | HC | refs | QC
HealthCheck Monitor
   HOME | UsersGuide
  sl icon ALL INSTRUMENTS
XSHOOTER:
distortion correction
Other HC:
QC links:
        [page auto-refreshes after 300 sec]   [stop | on]            [press Ctrl+R to enforce refresh of scores and dates]
XSHOOTER trending system: HEALTH CHECK report
Last update: 2012-05-23T23:07:09 (UT)
| now: 2012-05-24T18:19:00 (UT)
HELP USERS-GUIDE MORE
same group: number_identified gaps fmt_resid order_resid 2d_resid
General news: 2012-05-24: The HC monitors for OMEGACAM, VIRCAM and HAWKI are back. Population with current data is in progress.
XSHOOTER news: 2112-05-15: Garching pipeline upgraded to v1.4.8
Report news:  
DATE*: [?] 2012-05-17
report | NR
2012-05-18
report | NR
2012-05-19
report | NR
2012-05-20
report | NR
2012-05-21
report | NR
2012-05-22
report | NR
2012-05-23
report | NR
P...
Product quality:
products products products products products products products
  no OPSLOG data  

scores&comments | history ... | plot tutorial ... | contact               [?]
*Date on this monitor changes at 21:00 UT
Print: Information and research:
- png file - advanced studies: QC1 browser | QC1 plotter
Plot
?
Symb
?
Source
*
OPS?
**
Average ? Thresholds ? N_
data
QC1
parameter
Data
downloads
Remarks
method value unit method value
1 QC1DB no MEDIAN -0.39635 pixel VAL-5,0 157 fit_resx_min this | last_yr | all minimum residual in X
2 QC1DB no MEDIAN 2.90801 pixel VAL0,5 157 fit_resx_max this | last_yr | all maximum residual in X
3 QC1DB no MEDIAN 0.19082 pixel VAL0,0.35 157 fit_resx_rms this | last_yr | all rms of residuals in X
4 QC1DB no MEDIAN -0.89735 pixel VAL-6,0 157 fit_resy_min this | last_yr | all minimum residual in Y
5 QC1DB no MEDIAN 1.04989 pixel VAL0,6 157 fit_resy_max this | last_yr | all maximum residual in Y
6 QC1DB no MEDIAN 0.16938 pixel VAL0,0.6 157 fit_resy_rms this | last_yr | all rms of residuals in Y
*Data sources: QC1DB: QC1 database; LOCAL: local text file | **OPS: to indicate that OPSLOG data are included
Plot 1
scores: not implemented
data source:xshooter_format
(QC1 database)
dataset:fit_resx_min
median:-0.39635pixel
fixed thresholds:-5.0...0.0pixel
N_data plotted:157
[click on plot for closeup]
Plot 2
scores: not implemented
data source:xshooter_format
(QC1 database)
dataset:fit_resx_max
median:2.90801pixel
fixed thresholds:0.0...5.0pixel
N_data plotted:157
[click on plot for closeup]
Plot 3
scores: 4|
data source:xshooter_format
(QC1 database)
dataset:fit_resx_rms
median:0.19082pixel
fixed thresholds:0.0...0.35pixel
N_data plotted:157
[click on plot for closeup]
Plot 4
scores: not implemented
data source:xshooter_format
(QC1 database)
dataset:fit_resy_min
median:-0.89735pixel
fixed thresholds:-6.0...0.0pixel
N_data plotted:157
[click on plot for closeup]
Plot 5
scores: not implemented
data source:xshooter_format
(QC1 database)
dataset:fit_resy_max
median:1.04989pixel
fixed thresholds:0.0...6.0pixel
N_data plotted:157
[click on plot for closeup]
Plot 6
scores: 4|
data source:xshooter_format
(QC1 database)
dataset:fit_resy_rms
median:0.16938pixel
fixed thresholds:0.0...0.6pixel
N_data plotted:157
[click on plot for closeup]
This plot

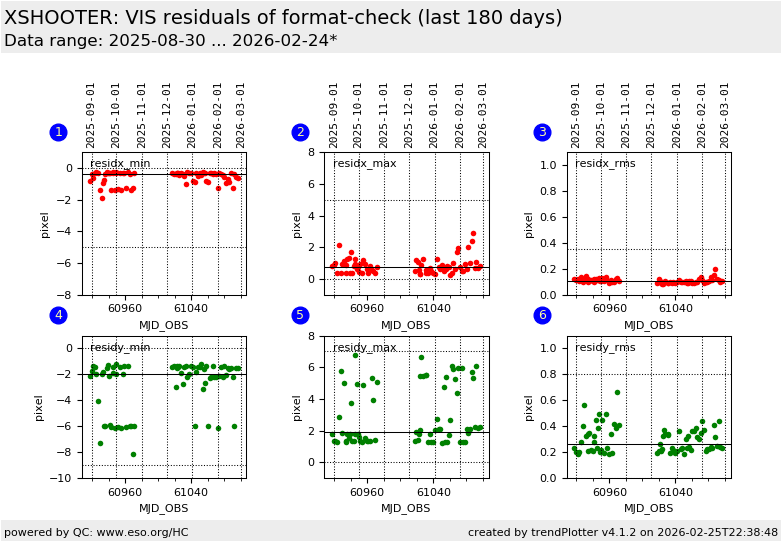
This plot shows the residuals of the lines in FMTCHK (1-pinhole arc) data after the annealing of the physical model. residx/y_min/max may be large due to single outliers and are therefore not scored. More information can be found in the plot tutorial page.  


General information

Click on any of the plots to see a close-up version. The latest date is indicated on top of the plot, data points belonging to that date are specially marked.

If configured,

  • statistical averages are indicated by a solid line, and thresholds by broken lines
  • outliers are marked by a red asterisk. They are defined as data points outside the threshold lines
  • "aliens" (= data points outside the plot Y limits) are marked by a red arrow ( or )
  • you can download the data for each parameter set if the 'Data downloads' link shows up