mirror sites: PL HQ

Health Check monitor


CAL | HC | refs | QC
HealthCheck Monitor
   HOME | UsersGuide
  sl icon ALL INSTRUMENTS
XSHOOTER:
distortion correction
Other HC:
QC links:
        [page auto-refreshes after 300 sec]   [stop | on]            [press Ctrl+R to enforce refresh of scores and dates]
XSHOOTER trending system: HEALTH CHECK report
Last update: 2012-05-23T23:11:49 (UT)
| now: 2012-05-24T18:25:54 (UT)
HELP USERS-GUIDE MORE
same group: number_identified gaps fmt_resid order_resid 2d_resid
General news: 2012-05-24: The HC monitors for OMEGACAM, VIRCAM and HAWKI are back. Population with current data is in progress.
XSHOOTER news: 2112-05-15: Garching pipeline upgraded to v1.4.8
Report news:  
DATE*: [?] 2012-05-17
report | NR
2012-05-18
report | NR
2012-05-19
report | NR
2012-05-20
report | NR
2012-05-21
report | NR
2012-05-22
report | NR
2012-05-23
report | NR
P...
Product quality:
products products products products products products products
  last OPSLOG data:
2012-05-22*

last files ...
monitor

scores&comments | history ... | plot tutorial ... | contact               [?]
*Date on this monitor changes at 21:00 UT
Print: Information and research:
- png file - advanced studies: QC1 browser | QC1 plotter
Plot
?
Symb
?
Source
*
OPS?
**
Average ? Thresholds ? N_
data
QC1
parameter
Data
downloads
Remarks
method value unit method value
1 QC1DB yes (4) none   NONE none   157 line_difmax this | last_yr | all largest gap between identified lines in format check
3 QC1DB yes (4) none   NONE none   157 line_difmax_ord this | last_yr | all order with largest gap in format check
2 QC1DB yes (4) none   NONE none   134 line_difmax this | last_yr | all largest gap between identified lines in 2dmap
4 QC1DB yes (4) none   NONE none   134 line_difmax_ord this | last_yr | all order with largest gap in 2dmap
*Data sources: QC1DB: QC1 database; LOCAL: local text file | **OPS: to indicate that OPSLOG data are included
Plot 1
scores: not implemented
data source:xshooter_format
(QC1 database)
dataset:line_difmax
average:none
thresholds:none
N_data plotted:157
[click on plot for closeup]
Plot 3
scores: not implemented
data source:xshooter_format
(QC1 database)
dataset:line_difmax_ord
average:none
thresholds:none
N_data plotted:157
[click on plot for closeup]
Plot 2
scores: not implemented
data source:xshooter_2dmap
(QC1 database)
dataset:line_difmax
average:none
thresholds:none
N_data plotted:134
[click on plot for closeup]
Plot 4
scores: not implemented
data source:xshooter_2dmap
(QC1 database)
dataset:line_difmax_ord
average:none
thresholds:none
N_data plotted:134
[click on plot for closeup]
This plot

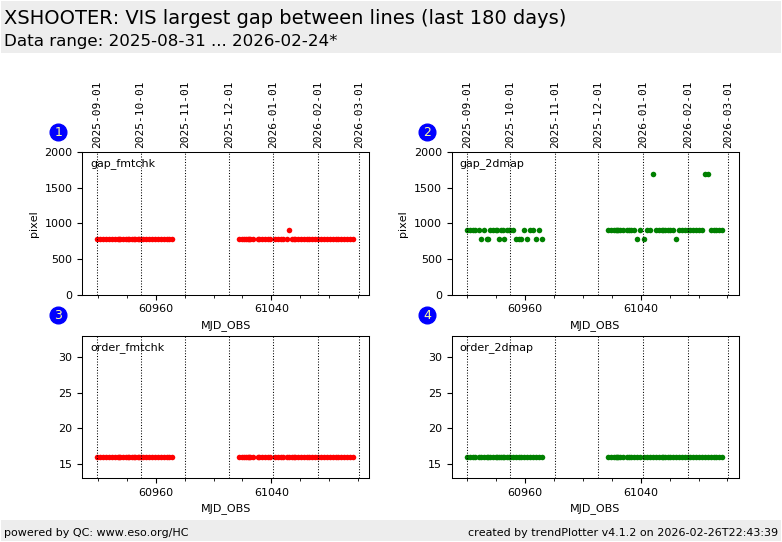
This plot shows the largest gap (in pixels) between identified lines in FMTCHK (1-pinhole arc) and 2DMAP (9-pinhole arc) data. We also show the number of the order in which the gap appears. More information can be found in the plot tutorial page.  


General information

Click on any of the plots to see a close-up version.

If applicable, the latest values from Paranal ops logs are plotted as blue dots. More information about those values, including a download option, is available in the OPS column.

The latest date is indicated on top of the plot, data points belonging to that date are specially marked.

If configured,

  • statistical averages are indicated by a solid line, and thresholds by broken lines
  • outliers are marked by a red asterisk. They are defined as data points outside the threshold lines
  • "aliens" (= data points outside the plot Y limits) are marked by a red arrow ( or )
  • you can download the data for each parameter set if the 'Data downloads' link shows up