Plot
? |
Symb
? |
Source
* |
OPS?
** |
Average ? |
Thresholds ? |
N_
data |
QC1
parameter |
Data
downloads |
Remarks |
| method |
value |
unit |
method |
value |
| 1 |
• | QC1DB |
no |
none |
|
ADU |
none | |
24 |
qc_corr_IL1 |
all (full time range)
| image to spectrum conversion for SW |
| 1 |
o | QC1DB |
no |
none |
|
ADU |
none | |
15 |
qc_corr_IL1 |
all (full time range)
| image to spectrum conversion for LW |
| 2 |
• | QC1DB |
no |
none |
|
ADU |
none | |
24 |
qc_corr_IL2 |
all (full time range)
| image to spectrum conversion for SW |
| 2 |
o | QC1DB |
no |
none |
|
ADU |
none | |
15 |
qc_corr_IL2 |
all (full time range)
| image to spectrum conversion for LW |
| 3 |
• | QC1DB |
no |
none |
|
ADU |
none | |
24 |
qc_corr_IL3 |
all (full time range)
| image to spectrum conversion for SW |
| 3 |
o | QC1DB |
no |
none |
|
ADU |
none | |
15 |
qc_corr_IL3 |
all (full time range)
| image to spectrum conversion for LW |
| 4 |
• | QC1DB |
no |
none |
|
ADU |
none | |
24 |
qc_corr_IM1 |
all (full time range)
| image to spectrum conversion for SW |
| 4 |
o | QC1DB |
no |
none |
|
ADU |
none | |
15 |
qc_corr_IM1 |
all (full time range)
| image to spectrum conversion for LW |
| 5 |
• | QC1DB |
no |
none |
|
ADU |
none | |
24 |
qc_corr_IM2 |
all (full time range)
| image to spectrum conversion for SW |
| 5 |
o | QC1DB |
no |
none |
|
ADU |
none | |
15 |
qc_corr_IM2 |
all (full time range)
| image to spectrum conversion for LW |
| 6 |
• | QC1DB |
no |
none |
|
ADU |
none | |
24 |
qc_corr_IM3 |
all (full time range)
| image to spectrum conversion for SW |
| 6 |
o | QC1DB |
no |
none |
|
ADU |
none | |
15 |
qc_corr_IM3 |
all (full time range)
| image to spectrum conversion for LW |
| |
|
*Data sources: QC1DB: QC1 database; LOCAL: local text file | **OPS: OPSLOG data are included
|
Plot 1
scores: not implemented
| | data source: | isaac_strace
(QC1 database) |
dataset:
(numbers below apply to this dataset) | qc_corr_IL1 | • |
| average: | none |
| thresholds: | none |
| N_data plotted: | 24 |
| [click on plot for closeup] |
Plot 2
scores: not implemented
| | data source: | isaac_strace
(QC1 database) |
dataset:
(numbers below apply to this dataset) | qc_corr_IL2 | • |
| average: | none |
| thresholds: | none |
| N_data plotted: | 24 |
| [click on plot for closeup] |
Plot 3
scores: not implemented
| | data source: | isaac_strace
(QC1 database) |
dataset:
(numbers below apply to this dataset) | qc_corr_IL3 | • |
| average: | none |
| thresholds: | none |
| N_data plotted: | 24 |
| [click on plot for closeup] |
Plot 4
scores: not implemented
| | data source: | isaac_strace
(QC1 database) |
dataset:
(numbers below apply to this dataset) | qc_corr_IM1 | • |
| average: | none |
| thresholds: | none |
| N_data plotted: | 24 |
| [click on plot for closeup] |
Plot 5
scores: not implemented
| | data source: | isaac_strace
(QC1 database) |
dataset:
(numbers below apply to this dataset) | qc_corr_IM2 | • |
| average: | none |
| thresholds: | none |
| N_data plotted: | 24 |
| [click on plot for closeup] |
Plot 6
scores: not implemented
| | data source: | isaac_strace
(QC1 database) |
dataset:
(numbers below apply to this dataset) | qc_corr_IM3 | • |
| average: | none |
| thresholds: | none |
| N_data plotted: | 24 |
| [click on plot for closeup] |
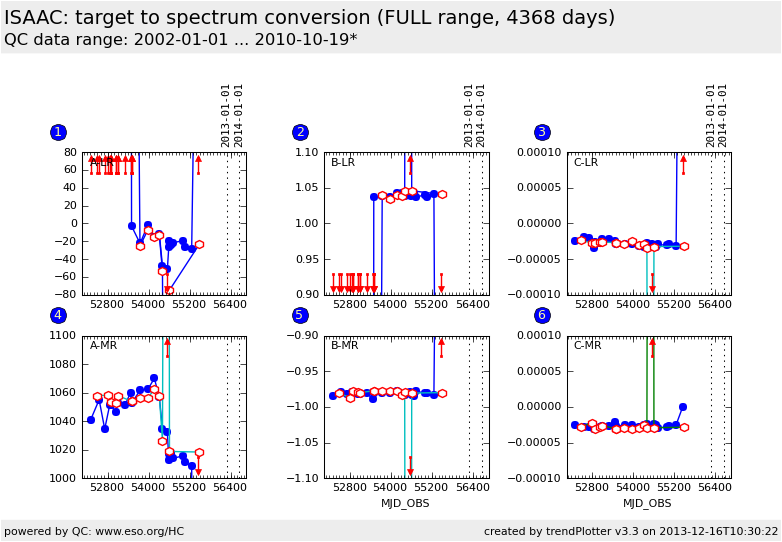
This is the trending plot for the ISAAC startrace calibrations
The optical position transformation in y-direction between the star in the
slit and the spectrum is described by a polynomial:
Y(image) = I1 + I2 * Y(spectrum) + I3 * Y^2(spectrum)
Startrace calibrations are acquired once per year.
The image orientation is flipped between LR and MR grating, hence LR and MR
coefficients differ. On 2006-01-01 (eclipse to cpl migration of the pipeline)
the definition of the polynom has changed for the LR-grating only for reasons
of homogenisation.
These plots describe:
Fig. 1. coefficient IL1, the offset in y for LR
Fig. 2. coefficient IL2, linear term in y for LR
Fig. 3. coefficient IL3, quadratic term in y for LR
Fig. 4. coefficient IM1, the offset in y for MR
Fig. 5. coefficient IM2, linear term in y for MR
Fig. 6. coefficient IM3, quadratic term in y for MR
Find more information about ISAAC QC parameters derived from arc lamp frames
here.
General information
Click on any of the plots to see a close-up version.
The latest date is indicated on top of the plot, data points belonging to that date are specially marked.
If configured,
- statistical averages are indicated by a solid line, and thresholds by broken lines
- outliers are marked by a red asterisk. They are defined as data points outside the
threshold lines
- "aliens" (= data points outside the plot Y limits) are marked by a red arrow (↑ or ↓)
- you can download the data for each parameter set if the 'Data downloads' link shows up
|

