Plot
? |
Symb
? |
Source
* |
Average ? |
Thresholds ? |
N_
data |
QC1
parameter |
Data
downloads |
Remarks |
| method |
value |
unit |
method |
value |
| 1 |
• | QC1DB |
MEDIAN |
5.84e+04 |
ADU |
VAL | 50000,65000 |
11 |
max_count |
this |
last_yr |
all
|
100k/1pt/hg |
| 2 |
• | QC1DB |
MEDIAN |
5.84e+04 |
ADU |
VAL | 50000,65000 |
13 |
max_count |
this |
last_yr |
all
|
100k/1pt/hg/1x2 |
| 3 |
• | QC1DB |
MEDIAN |
6.11e+04 |
ADU |
VAL | 50000,65000 |
13 |
max_count |
this |
last_yr |
all
|
|
| 4 |
• | QC1DB |
MEDIAN |
6.02e+04 |
ADU |
VAL | 50000,65000 |
11 |
max_count |
this |
last_yr |
all
|
400k/1pt/lg |
| 5 |
• | QC1DB |
MEDIAN |
5.62e+04 |
ADU |
VAL | 50000,65000 |
11 |
max_count |
this |
last_yr |
all
|
400k/1pt/lg/1x2 |
| 6 |
• | QC1DB |
MEDIAN |
6.11e+04 |
ADU |
VAL | 50000,65000 |
12 |
max_count |
this |
last_yr |
all
|
|
| |
|
*Data sources: QC1DB: QC1 database; LOCAL: local data source
|
Plot 1
scores: not implemented
| | data source: | xshooter_detmon
(QC1 database) |
| dataset: | max_count | • |
| median: | 5.84e+04 | ADU |
| fixed thresholds: | 50000...65000 | ADU |
| N_data plotted: | 11 |
| [click plot for closeup] |
Plot 2
scores: not implemented
| | data source: | xshooter_detmon
(QC1 database) |
| dataset: | max_count | • |
| median: | 5.84e+04 | ADU |
| fixed thresholds: | 50000...65000 | ADU |
| N_data plotted: | 13 |
| [click plot for closeup] |
Plot 3
scores: not implemented
| | data source: | xshooter_detmon
(QC1 database) |
| dataset: | max_count | • |
| median: | 6.11e+04 | ADU |
| fixed thresholds: | 50000...65000 | ADU |
| N_data plotted: | 13 |
| [click plot for closeup] |
Plot 4
scores: not implemented
| | data source: | xshooter_detmon
(QC1 database) |
| dataset: | max_count | • |
| median: | 6.02e+04 | ADU |
| fixed thresholds: | 50000...65000 | ADU |
| N_data plotted: | 11 |
| [click plot for closeup] |
Plot 5
scores: not implemented
| | data source: | xshooter_detmon
(QC1 database) |
| dataset: | max_count | • |
| median: | 5.62e+04 | ADU |
| fixed thresholds: | 50000...65000 | ADU |
| N_data plotted: | 11 |
| [click plot for closeup] |
Plot 6
scores: not implemented
| | data source: | xshooter_detmon
(QC1 database) |
| dataset: | max_count | • |
| median: | 6.11e+04 | ADU |
| fixed thresholds: | 50000...65000 | ADU |
| N_data plotted: | 12 |
| [click plot for closeup] |
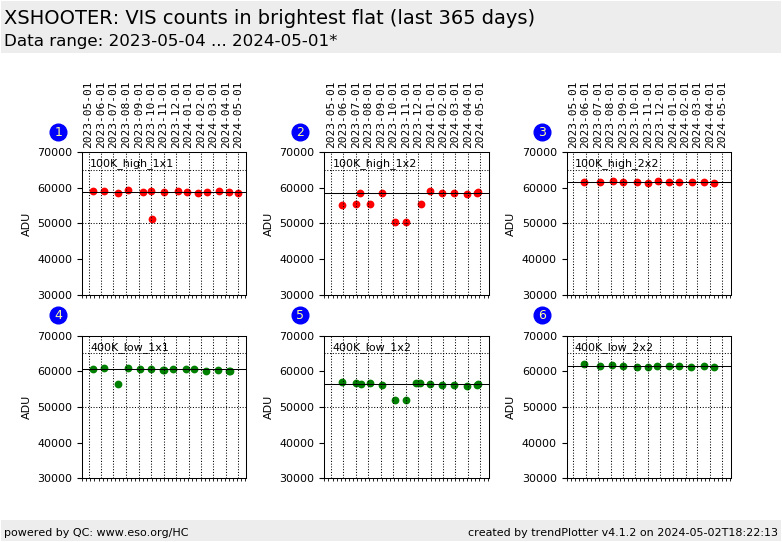
This plot shows the median counts of the brightest non-rejected flat used by the detector monitoring recipe.
upper threshold = 46000 ADU: Due to the inhomogenous illumination of the VIS imaging flats, the most illuminated pixel
regions begin to saturate (counts = 65535 ADU) for frames with median counts > 46000 ADU.
lower threshold = 40000 ADU: Sampling smaller flux ranges means covering the linear part of the
of the detector response curve only. The non-linearity
expressed as a fraction at the reference flux level of 50000 ADU should be based on a flux
range exceeding the 40 000 ADU. Otherwise the linearity QC parameter becomes
more and more a function of the flux range.
General information
Click on any of the plots to see a close-up version.
The latest date is indicated on top of the plot.
If configured,
- data points belonging to the latest date are specially marked
- statistical averages are indicated by a solid line, and thresholds by broken lines
- outliers are marked by a red asterisk. They are defined as data points outside the
threshold lines
- "aliens" (= data points outside the plot Y limits) are marked by a red arrow (↑ or ↓)
- you can download the data for each parameter set if the 'Data downloads' link shows up
|
