| This documentation is intended both for QC scientists and SciOps astronomers (who may want to ignore the technical information displayed in grey). | ||||||||||||||||||||||||||||
|
||||||||||||||||||||||||||||
|
||||||||||||||||||||||||||||
| bottom plots | contact | ||||||||||||||||||||||||||||
| NAME | QCocam_lingain.py | |||||||||||||||||||||||||||
| VERSION | 1.0 -- 2012-06-10 First draft of this QC report | |||||||||||||||||||||||||||
| SYNTAX | Python | |||||||||||||||||||||||||||
| CALL |
measureQuality of data contained in $DFS_PRODUCT/DETGAIN/$DATE within processQC: processQC -a $AB explicit call: QCocam_lingain.py -a [$AB_name] -e [$ext_number: 1-32] -i [$level_of_interaction: 0-2] | |||||||||||||||||||||||||||
| INSTRUMENT | OMEGACAM | |||||||||||||||||||||||||||
| RAWTYPE | DETGAIN (DPR.TYPE = FLAT,DOME,DETGAIN) | |||||||||||||||||||||||||||
| PURPOSE |
a) generates 3 QC reports for each OmegaCAM CCD b) writes QC1 parameters into local QC1 database omegacam_detlin | |||||||||||||||||||||||||||
| PROCINPUT |
No input is required: a) $DATE is read from AB b) the primary file is set in QCocam_lingain.py and is the PRO.CATG=GAIN_INFO product with the _0000.fits extension. c) raw frames are implicitly read from the AB. d) All reference products: GAIN_INFO, DET_LIN_INFO, BP_MAP_NL, COEFFS_CUBE_P0, COEFFS_CUBE_P1, COEFFS_CUBE_P2, and COEFFS_CUBE_P3 are found and read in from $DFO_ROOT_DIR_FC/calib/references/DETGAIN/. | |||||||||||||||||||||||||||
| QC1TABLE |
trending | table(s) in QC1 database: omegacam_detlin | |||||||||||||||||||||||||||
| TRENDPLOT |
trending | HealthCheck plot(s) associated to this procedure: trend_report_GAIN_HC.html | |||||||||||||||||||||||||||
| QC1PAGE |
trending | associated documentation: gain_QC1.html | |||||||||||||||||||||||||||
| QC1PLOTS top |
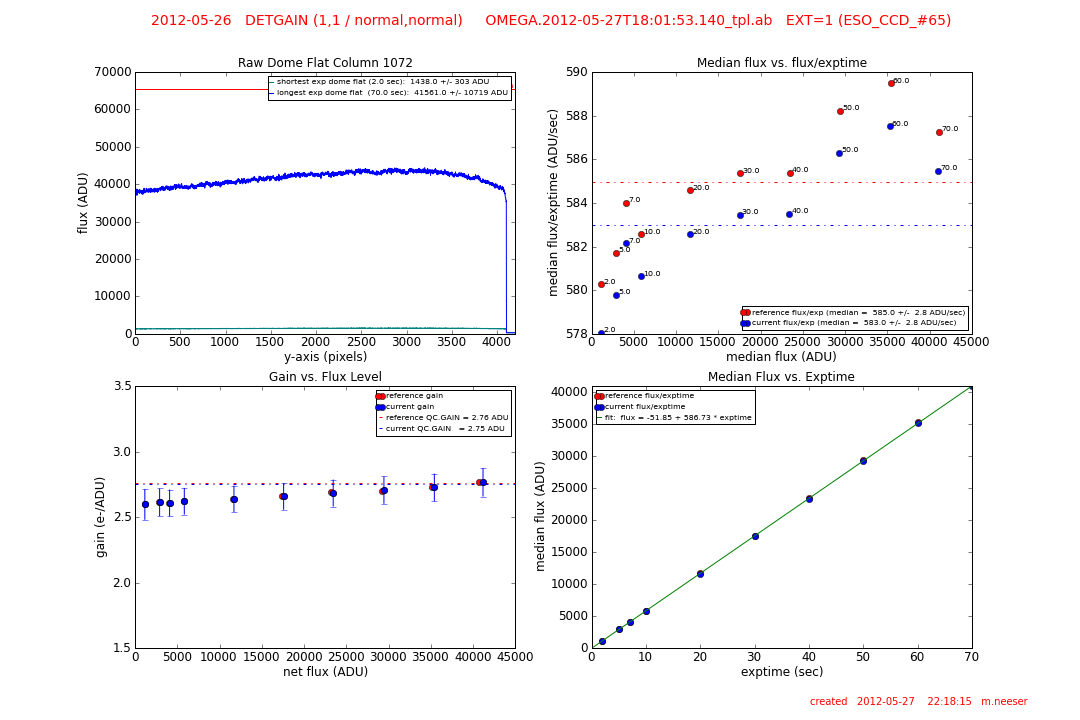
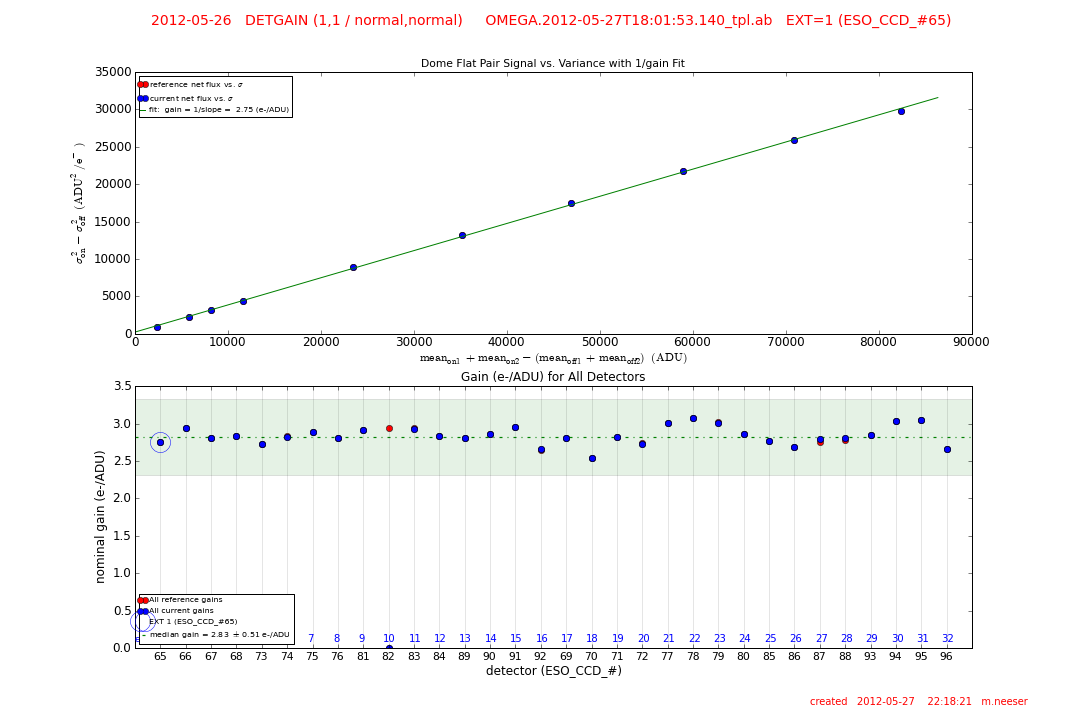
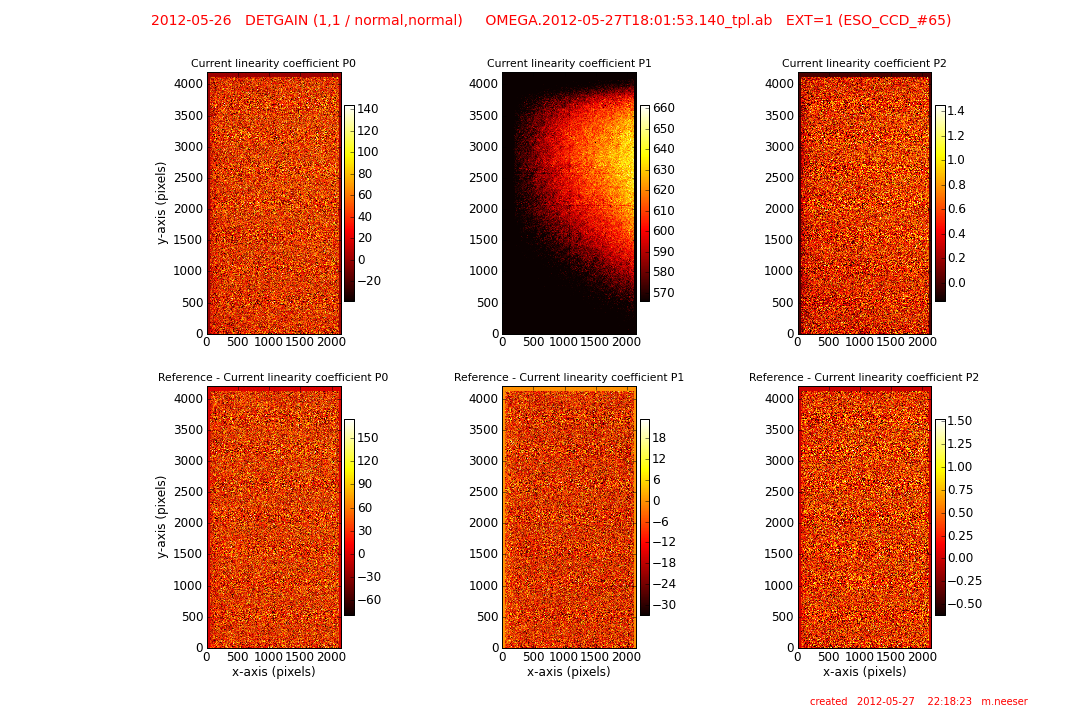
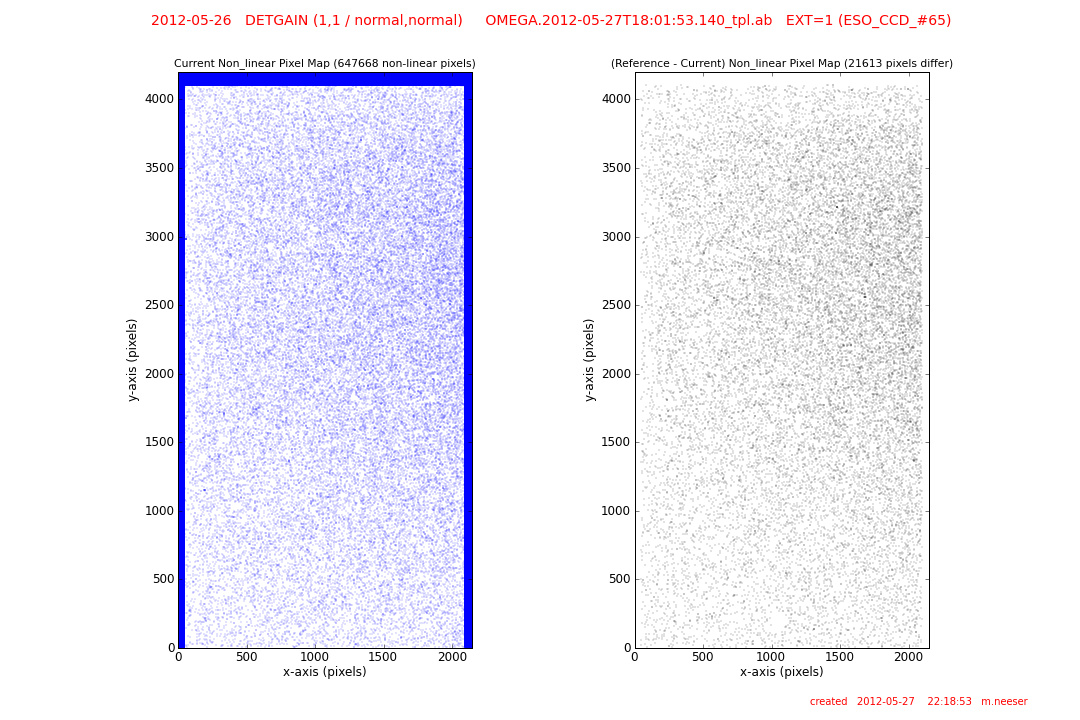
lingain1.png top left: a) an average column trace through the raw dome having the longest exposure time (blue line). b) an average column trace through the raw dome having the shortest exposure time (green line). The mean flux levels of both extremes are given in the legend and the saturation line at 65,000 ADU (red line) is also shown. The intent is to flag saturated dome flats. top right: the median flux per exposure time (ADU/second) vs. the median total flux (ADU) for the current set of dome flats (blue points) and the reference dome flats (red points). The exposure times of each flat (2 -> 70 seconds) is listed next to each data point. The median levels are shown as dotted lines and listed in the figure legend. lower left: the gain (electrons/ADU) vs. the net flux (ADU) for each dome flat in the gain/linearity template. The current gain values are shown with blue points, while the reference values are red. The gain levels assumed by the pipeline (QC.GAIN) are given in the legend and plotted as dotted lines. The change in gain as a function of net flux is obvious. lower right: the median flux level (ADU) for each dome flat in the gain/linearity template vs. the exposure time is plotted for the current data (blue points) and the reference data (red points). A fit to the relation is shown as a green line and is listed in the legend. lingain2.png top: by plotting the signal of dome flat pairs vs. variance one can compute the gain over the full flux range. Plotting the mean_flux[on_1] + mean_flux[on_2] - (mean_flux[off_1] + mean_flux[off_2]) vs the variance (sigma^2[on] - sigma^2[off]) for each dome flat exposure pair, a linear fit to the data (green line) gives the inverse (1/gain) gain value (e-/ADU). bottom: the gain (e-/ADU) as measured for ALL OmegaCAM detectors. The current gain values are shown as blue dots, the reference gains are shown as red dots. The median current gain is shown as a dotted green line with its +/- 1 sigma shaded green. The current detector is circled and the median gain is listed in the legend. lingain3.png top left: the full-frame, current linearity coefficient P0. top center: the full-frame, current linearity coefficient P1. top right: the full-frame, current linearity coefficient P2. lower left: the difference between the reference and the current linearity coefficient P0. lower center: the difference between the reference and the current linearity coefficient P1. lower right: the difference between the reference and the current linearity coefficient P2. lingain4.png left: a map of the positions of non-linear pixels. The total number of non-linear pixels is listed at the top of the frame. right: a map of the positions of non-linear pixels that differ between the reference and current non-linearity maps. The total number of differing pixels is listed at the top of the frame. | |||||||||||||||||||||||||||
| QC1PARAM |
QC1 parameters written into QC1 table(omegacam_detlin) SOURCE(header or script) DBNAME value description | |||||||||||||||||||||||||||
| ALGORITHM | ||||||||||||||||||||||||||||
| CERTIF |
- The OmegaCAM linearity/gain template consists of 20 dome flat images taken in pairs of 2, 5, 7, 10, 20, 30, 40, 50, 60, and 70 second exposures
and two bias frame exposures. The template MUST be executed in the v_STRM filter, since using the Sloan filters would result in the long
exposures saturating (e.g. in z_SDSS the dome flat will saturate in 4.0 seconds). - Check that the longest exposure is not saturated. This will be obvious from QC report 2 which plots the trace of the shortest and longest exposure dome flats. Saturated dome flats should be rejected and Paranal advised to repeat the linearity/gain template. | |||||||||||||||||||||||||||
| COMMENTS | OmegaCAM linearity/gain frames are normally taken every 10 days and consist of 20 raw screen flats in the v_STRM filter and 2 bias frames. | |||||||||||||||||||||||||||
| top | [2015-11-05T15:10:17] created by qcDocu v1.1.2, a tqs tool | |||||||||||||||||||||||||||