| This documentation is intended both for QC scientists and SciOps astronomers (who may want to ignore the technical information displayed in grey). | ||||||||||||||||||||||||||||
|
||||||||||||||||||||||||||||
| bottom plots | contact | ||||||||||||||||||||||||||||
| NAME | fmtcheck_fib.prg | |||||||||||||||||||||||||||
| VERSION | 1.1 | |||||||||||||||||||||||||||
| SYNTAX | MIDAS | |||||||||||||||||||||||||||
| CALL |
from $DFS_PRODUCT/BIAS_RED/$DATE: uves.MeasureQuality -a <AB> -c fmtcheck_fib.prg [-i|--NOingestQC1pars] where | |||||||||||||||||||||||||||
| INSTRUMENT | UVES | |||||||||||||||||||||||||||
| RAWTYPE | FMTCHK_MOS_RED | |||||||||||||||||||||||||||
| PURPOSE |
Comparison of raw, master and/or reference FMTCHK_MOS_RED files
for UVES QC assessment;
QC1 values are calculated and fed into the QC1 table.
QC1 plot(s) and/or display(s) are generated,
and later reviewed within certifyProducts. The generated plots stored in $DFO_PLT_DIR/$DATE with the name r.<DPid>_tpl_0000.fits.png where <DPid> is the Data Product Identification of the first frame of the template. | |||||||||||||||||||||||||||
| PROCINPUT | RAW frame from AB; FIB_ORD_GUE_RED[U|L], FIB_LIN_GUE_RED[U|L] & BACKGR_TABLE_RED[U|L] products | |||||||||||||||||||||||||||
| QC1TABLE |
trending | table(s) in QC1 database: uves_fib_fmtchk | |||||||||||||||||||||||||||
| TRENDPLOT |
trending | HealthCheck plot(s) associated to this procedure: HEALTH/trend_report_MOS_FMTCHK_GratPos_PhysM_520_P1_DHC_HC.html | |||||||||||||||||||||||||||
| QC1PAGE |
trending | associated documentation: ffmtchk_qc1.html | |||||||||||||||||||||||||||
| QC1PLOTS top |
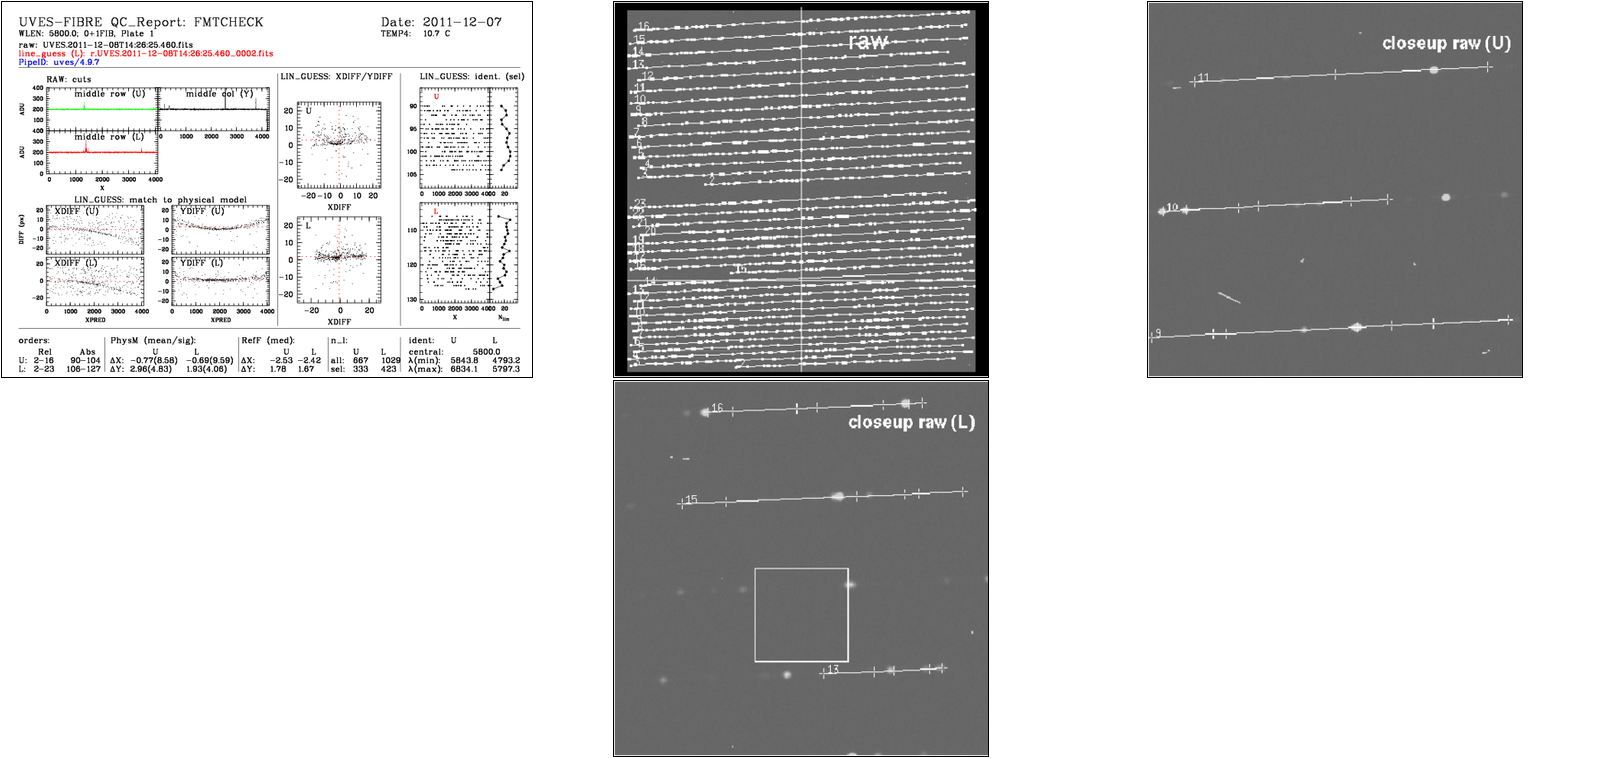
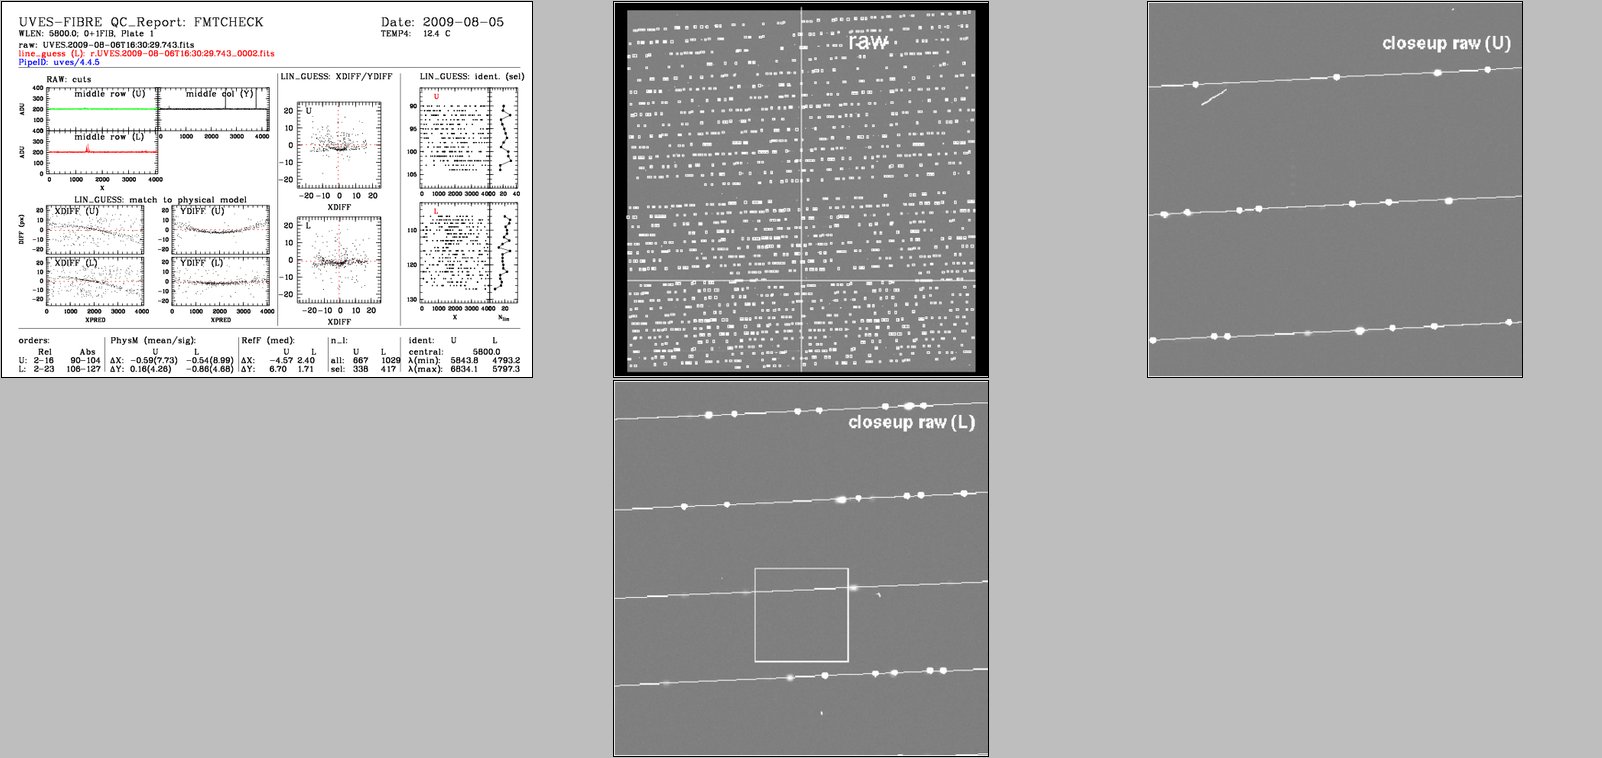
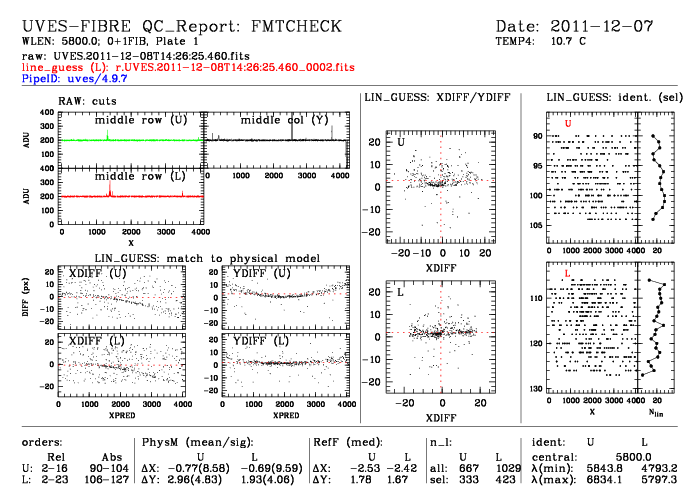
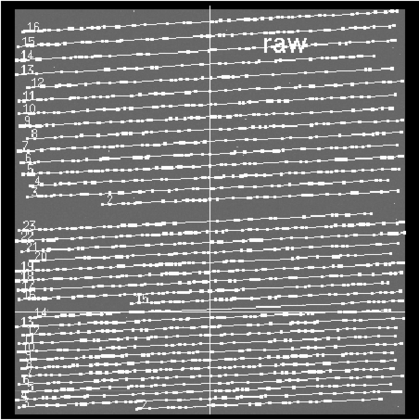
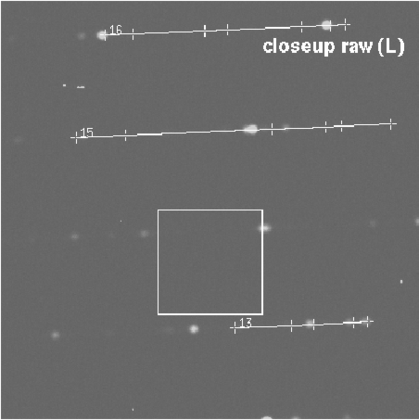
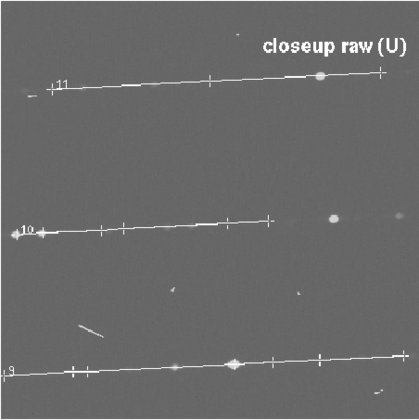
fmtchk_mos_red.montage.png A montage image made up of the following individual reports simply for the purposes of easier/better display in XV during the certification process. Created together with the reference montage (see below) within the uves.MeasureQuality script. Can be recreated manually by calling the script uves.makeQCreportMontage -a <AB>, see uves.makeQCreportMontage -h for more details. fmtchk_mos_red.montage.ref.png A montage image made up from the individual QC reports of the reference AB located by the script uves.getRefAB. During certification, the two montage images are blinked to facilitate identification of unusual features. This reference montage created at the same time as the AB montage (see above).The montage of the reference AB is easily identified during the blinking as the one with the grey background. fmtchk_mos_red_0002.fits.png From left to right (more or less), top to bottom: plot 1:trace across the central row of the RAW frame of the UPPER chip plot 2:trace across the central row of the RAW frame of the LOWER chip plot 3:trace across the central column of the RAW frame plot 4:XDIFF vs YDIFF plot for the UPPER chip, where XDIFF & YDIFF are the differences between the measured positions of each line and the positions expected from the physical model. Ideally the points in this plot should cluster about 0,0, but the pipeline seems capable to cope with deviations of upto -10,+10 in both axes (the pipeline developer expects 'problems' at values much larger than +/-10 however this range has not been 'explored' in normal operations). Jumps (of completely unpredicatable nature) are often seen in these parameters due to earthquakes and any other influence (e.g. maintenance/intervention operations) which 'disturb' the instrument. Jumps in BLUE and RED arms can be completely UNCORRELATED. plot 5:Distribution of located lines by echelle order for the UPPER chip, plus number of lines per order plot 6:XDIFFs (as above) as a function of position along each order for the UPPER chip plot 7:XDIFFs (as above) as a function of position along each order for the LOWER chip plot 8:YDIFFs (as above) as a function of position along each order for the UPPER chip plot 9:YDIFFs (as above) as a function of position along each order for the LOWER chip plot 10:XDIFF vs YDIFF plot for the LOWER chip, where XDIFF & YDIFF are the differences between the measured positions of each line and the positions expected from the physical model. Ideally the points in this plot should cluster about 0,0, but the pipeline seems capable to cope with deviations of upto -10,+10 in both axes (the pipeline developer expects 'problems' at values much larger than +/-10 however this range has not been 'explored' in normal operations). Jumps (of completely unpredicatable nature) are often seen in these parameters due to earthquakes and any other influence (e.g. maintenance/intervention operations) which 'disturb' the instrument. Jumps in BLUE and RED arms can be completely UNCORRELATED. plot 11:Distribution of located lines by echelle order for the LOWER chip, plus number of lines per order fmtchk_mos_red_0002.fits_1.ima.png MIDAS display of the RAW frame (both CHIPs) with the located emission lines indicated by squares and all squares within a given order joined by a line. fmtchk_mos_red_0002.fits_2.ima.png Same as previous but closeup of central region of LOWER chip with lines indicated by crosses. Note also that the "joining lines" only show joined up to the points within the display, so short lines or orders without any points at all in the displayed central region does NOT indicated no points at all (or no more) in the order, outside the displayed region. fmtchk_mos_red_0002.fits_3.ima.png Same as previous but closeup of central region of UPPER chip with lines indicated by crosses. Note also that the "joining lines" only show joined up to the points within the display, so short lines or orders without any points at all in the displayed central region does NOT indicated no points at all (or no more) in the order, outside the displayed region. | |||||||||||||||||||||||||||
| QC1PARAM |
QC1 parameters written into QC1 table: QC1db names: lambda_min | lambda_max | order_min | order_max | mean_dx | sigma_dx | mean_dy | sigma_dy | median_shftx | median_shfty | nlin_all | nlin_sel | ins_temp4_mean | ins_temp1_mean | ins_press_mean FITS key names: QC.WLENMIN | QC.WLENMAX | QC.ORDMIN | QC.ORDMAX | QC.MODEL.DIFFXAVG | QC.MODEL.DIFFXRMS | QC.MODEL.DIFFYAVG | QC.MODEL.DIFFYRMS | QC.SHFTXMED | QC.SHFTYMED | QC.MODEL.NLINALL | QC.MODEL.NLINSEL | INS.TEMP4.MEAN | INS.TEMP1.MEAN | INS.SENS26.MEAN QC1 params created by pipeline: QC1 params created by this procedure: | |||||||||||||||||||||||||||
| ALGORITHM |
Description of algorithms: Algorithms for pipeline created keywords are (in principal) described in the pipeline user's manual
| |||||||||||||||||||||||||||
| CERTIF |
Reasons for rejection:
| |||||||||||||||||||||||||||
| COMMENTS | None | |||||||||||||||||||||||||||
| top | [2015-10-30T08:21:19] created by qcDocu v1.1.2, a tqs tool | |||||||||||||||||||||||||||