| This documentation is intended both for QC scientists and SciOps astronomers (who may want to ignore the technical information displayed in grey). | ||||||||||||||||||||||||||||
|
||||||||||||||||||||||||||||
| bottom plots | contact | ||||||||||||||||||||||||||||
| NAME | orderdef_fib.prg | |||||||||||||||||||||||||||
| VERSION | 1.1 | |||||||||||||||||||||||||||
| SYNTAX | MIDAS | |||||||||||||||||||||||||||
| CALL |
from $DFS_PRODUCT/BIAS_RED/$DATE: uves.MeasureQuality -a <AB> -c orderdef_fib.prg [-i|--NOingestQC1pars] where | |||||||||||||||||||||||||||
| INSTRUMENT | UVES | |||||||||||||||||||||||||||
| RAWTYPE | ORDERDEF_MOS_RED | |||||||||||||||||||||||||||
| PURPOSE |
Comparison of raw, master and/or reference ORDERDEF_MOS_RED files
for UVES QC assessment;
QC1 values are calculated and fed into the QC1 table.
QC1 plot(s) and/or display(s) are generated,
and later reviewed within certifyProducts. The generated plots stored in $DFO_PLT_DIR/$DATE with the name r.<DPid>_tpl_0000.fits.png where <DPid> is the Data Product Identification of the first frame of the template. | |||||||||||||||||||||||||||
| PROCINPUT | RAW frame from AB; FIB_ORD_TAB_RED[U|L] & FIB_BKG_TABLE_RED[U|L] products | |||||||||||||||||||||||||||
| QC1TABLE |
trending | table(s) in QC1 database: uves_fib_orderdef | |||||||||||||||||||||||||||
| TRENDPLOT |
trending | HealthCheck plot(s) associated to this procedure: None | |||||||||||||||||||||||||||
| QC1PAGE |
trending | associated documentation: None | |||||||||||||||||||||||||||
| QC1PLOTS top |
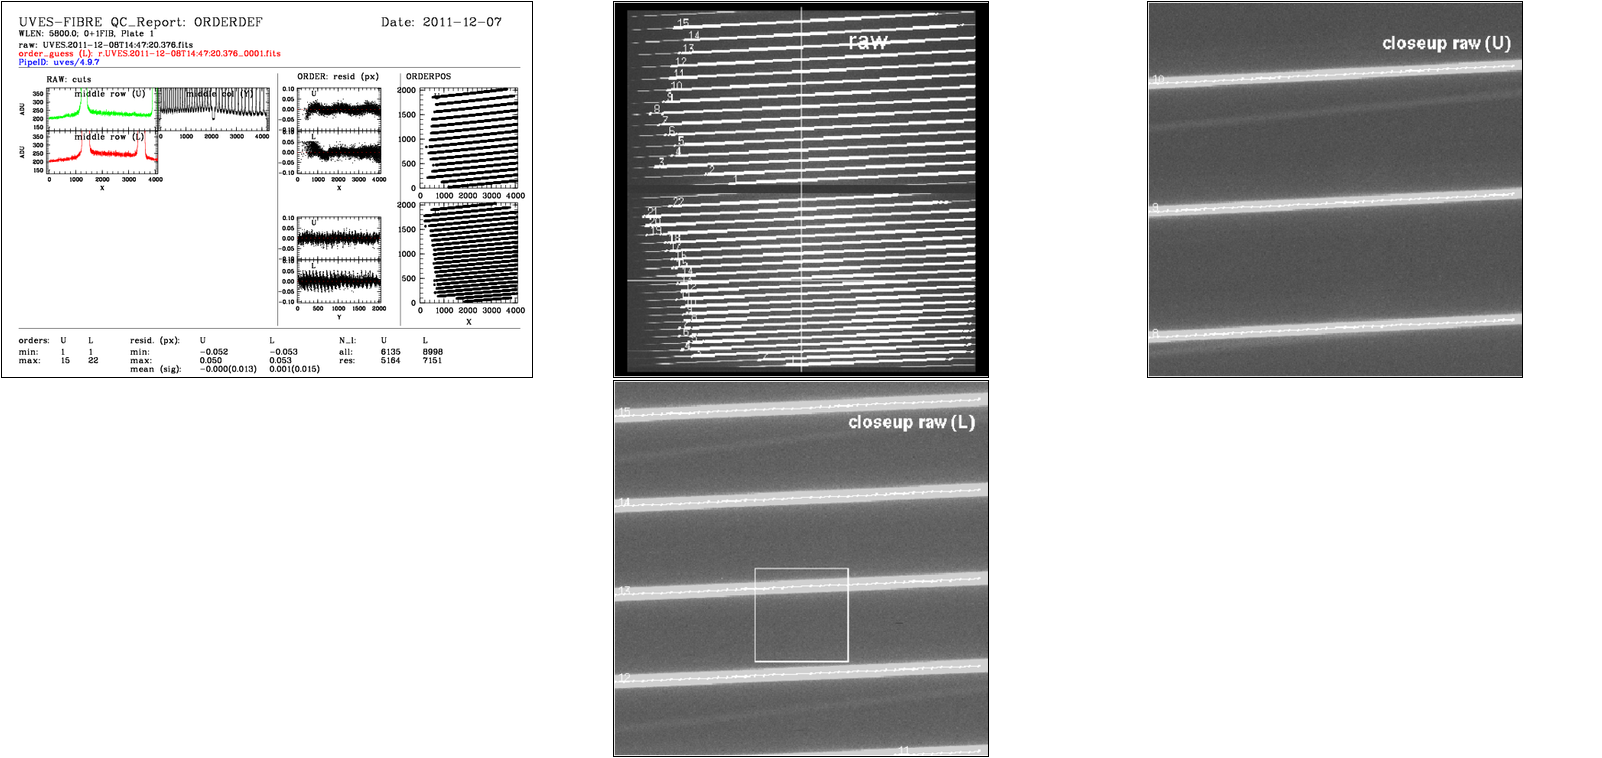
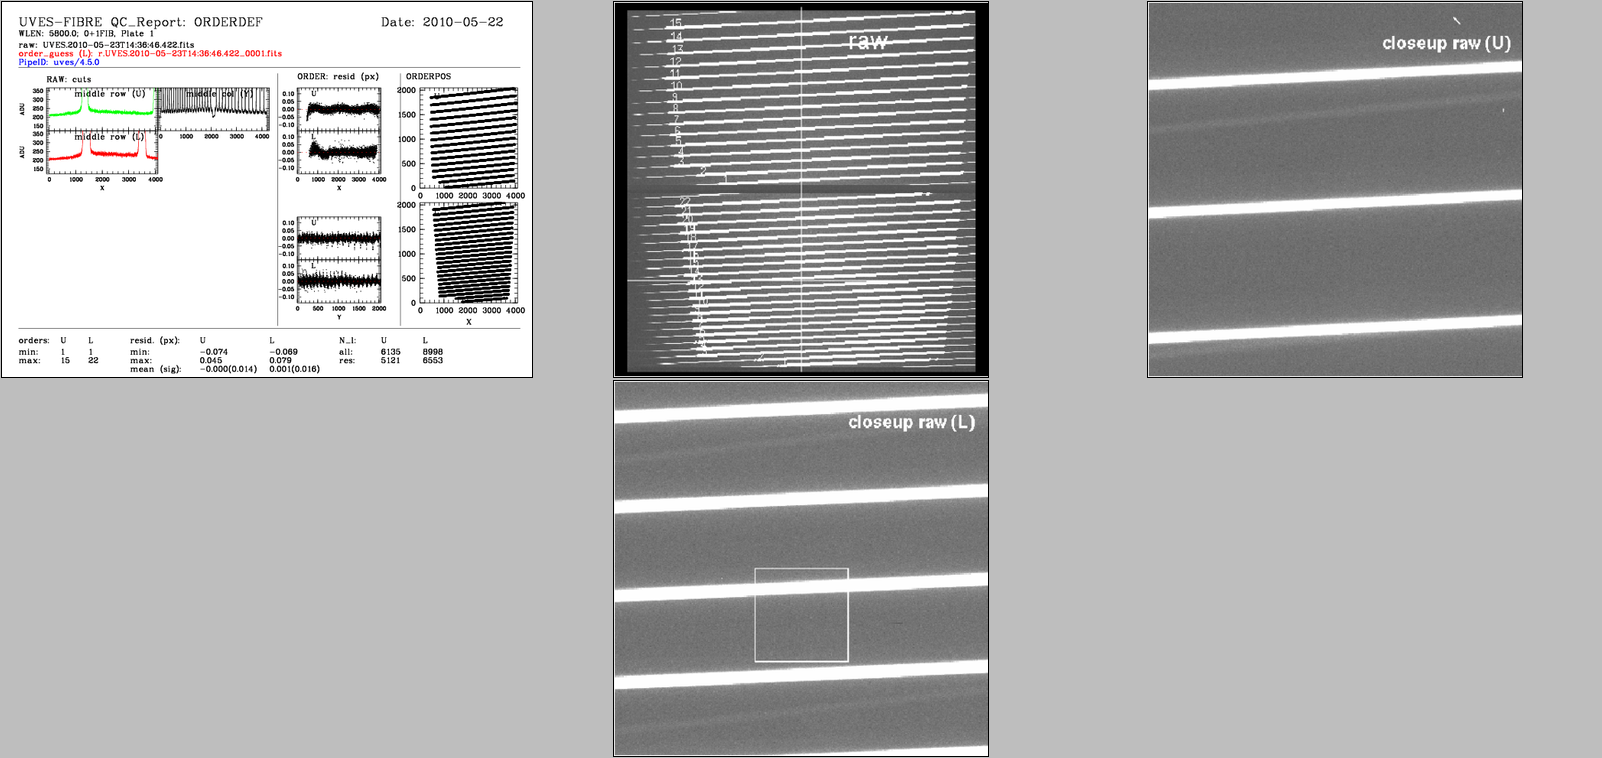
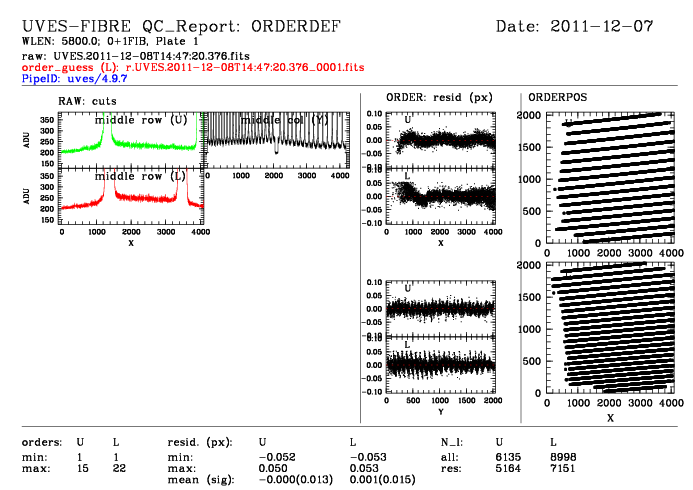
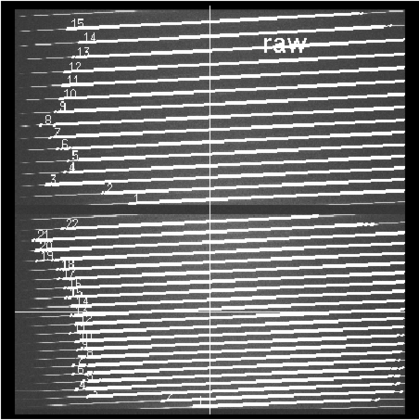
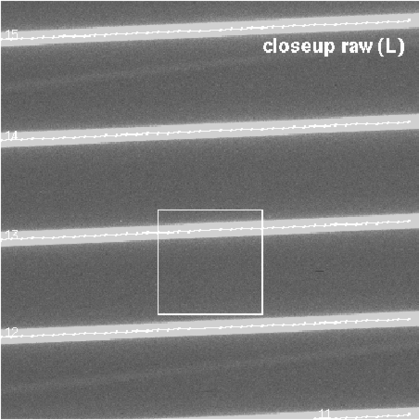
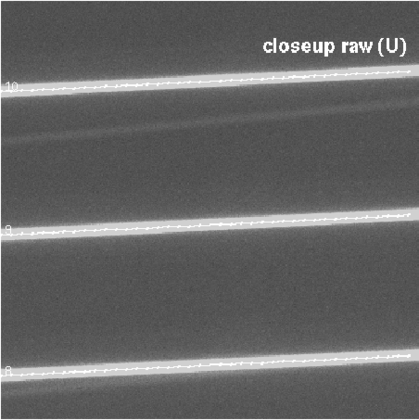
orderdef_mos_red.montage.png A montage image made up of the following individual reports simply for the purposes of easier/better display in XV during the certification process. Created together with the reference montage (see below) within the uves.MeasureQuality script. Can be recreated manually by calling the script uves.makeQCreportMontage -a <AB>, see uves.makeQCreportMontage -h for more details. orderdef_mos_red.montage.ref.png A montage image made up from the individual QC reports of the reference AB located by the script uves.getRefAB. During certification, the two montage images are blinked to facilitate identification of unusual features. This reference montage created at the same time as the AB montage (see above).The montage of the reference AB is easily identified during the blinking as the one with the grey background. orderdef_mos_red_0001.fits.png From left to right (more or less) top to bottom: plot 1:trace across the central row of the UPPER chip of the RAW frame plot 2:trace across the central column of the complete RAW frame (both chips) plot 3:Residuals in X (i.e. along the order, dispersion direction) of the fitted positions of the order with respect to the expected positions of the physical model for the UPPER chip plot 4:Residuals in X (i.e. along the order, dispersion direction) of the fitted positions of the order with respect to the expected positions of the physical model for the LOWER chip plot 5:Representation of the order positions in X-Y pixel space for the UPPER chip. plot 6:trace across the central row of the LOWER chip of the RAW frame plot 7:Residuals in Y (i.e. along the order, dispersion direction) of the fitted positions of the order with respect to the expected positions of the physical model for the UPPER chip plot 8:Residuals in Y (i.e. along the order, dispersion direction) of the fitted positions of the order with respect to the expected positions of the physical model for the LOWER chip plot 9:Representation of the order positions in X-Y pixel space for the LOWER chip. orderdef_mos_red_0001.fits_1.ima.png MIDAS display of the RAW frame showing BOTH CHIPs with the located and traced orders indicated by squares (in this view the squares are relatively large and close together giving the impression of continuous lines). Each order is traced at regular steps along the order, each step is indicated by a square. orderdef_mos_red_0001.fits_2.ima.png Same as previous but closeup of central region of the LOWER chip with each step indicated by a (rather) small cross and joined by a line. orderdef_mos_red_0001.fits_3.ima.png Same as previous but closeup of central region of the UPPER chip with each step indicated by a (rather) small cross and joined by a line. | |||||||||||||||||||||||||||
| QC1PARAM |
QC1 parameters written into QC1 table: QC1db names: order_min | order_max | resid_min | resid_max | resid_mean | resid_sigma | npos_all | npos_sel FITS key names: QC.ORDMIN | QC.ORDMAX | QC.ORD.RESIDMIN | QC.ORD.RESIDMAX | QC.ORD.RESIDAVG | QC.ORD.RESIDRMS | QC.ORD.NPOSALL | QC.ORD.NPOSSEL QC1 params created by pipeline: QC1 params created by this procedure: | |||||||||||||||||||||||||||
| ALGORITHM |
Description of algorithms: Algorithms for pipeline created keywords are (in principal) described in the pipeline user's manual
| |||||||||||||||||||||||||||
| CERTIF |
| |||||||||||||||||||||||||||
| COMMENTS | None | |||||||||||||||||||||||||||
| top | [2015-10-30T08:21:22] created by qcDocu v1.1.2, a tqs tool | |||||||||||||||||||||||||||