| This documentation is intended both for QC scientists and SciOps astronomers (who may want to ignore the technical information displayed in grey). | ||||||||||||||||||||||||||||
|
||||||||||||||||||||||||||||
| bottom plots | contact | ||||||||||||||||||||||||||||
| NAME | wave_red.prg | |||||||||||||||||||||||||||
| VERSION | 2.5 | |||||||||||||||||||||||||||
| SYNTAX | MIDAS | |||||||||||||||||||||||||||
| CALL |
from $DFS_PRODUCT/BIAS_RED/$DATE: uves.MeasureQuality -a <AB> -c wave_red.prg [-i|--NOingestQC1pars] where | |||||||||||||||||||||||||||
| INSTRUMENT | UVES | |||||||||||||||||||||||||||
| RAWTYPE | WAVE_ECH_RED | |||||||||||||||||||||||||||
| PURPOSE |
Comparison of raw, master and/or reference WAVE_ECH_RED files
for UVES QC assessment;
QC1 values are calculated and fed into the QC1 table.
QC1 plot(s) and/or display(s) are generated,
and later reviewed within certifyProducts. The generated plots stored in $DFO_PLT_DIR/$DATE with the name r.<DPid>_tpl_0000.fits.png where <DPid> is the Data Product Identification of the first frame of the template. | |||||||||||||||||||||||||||
| PROCINPUT | RAW frame from AB; LINE_TABLE_RED[U|L](s) products (the MIDAS version of the PL produced three LINE_TABLE_RED[U|L] products (LINE_TABLE_RED[U|L]1, LINE_TABLE_RED[U|L]2 & LINE_TABLE_RED[U|L]3, this script still copes with both flavours) | |||||||||||||||||||||||||||
| QC1TABLE |
trending | table(s) in QC1 database: uves_wave | |||||||||||||||||||||||||||
| TRENDPLOT |
trending | HealthCheck plot(s) associated to this procedure: HEALTH/trend_report_ECH_RESOLUTION_DHC_HC.html | |||||||||||||||||||||||||||
| QC1PAGE |
trending | associated documentation: wave_qc1.html | |||||||||||||||||||||||||||
| QC1PLOTS top |
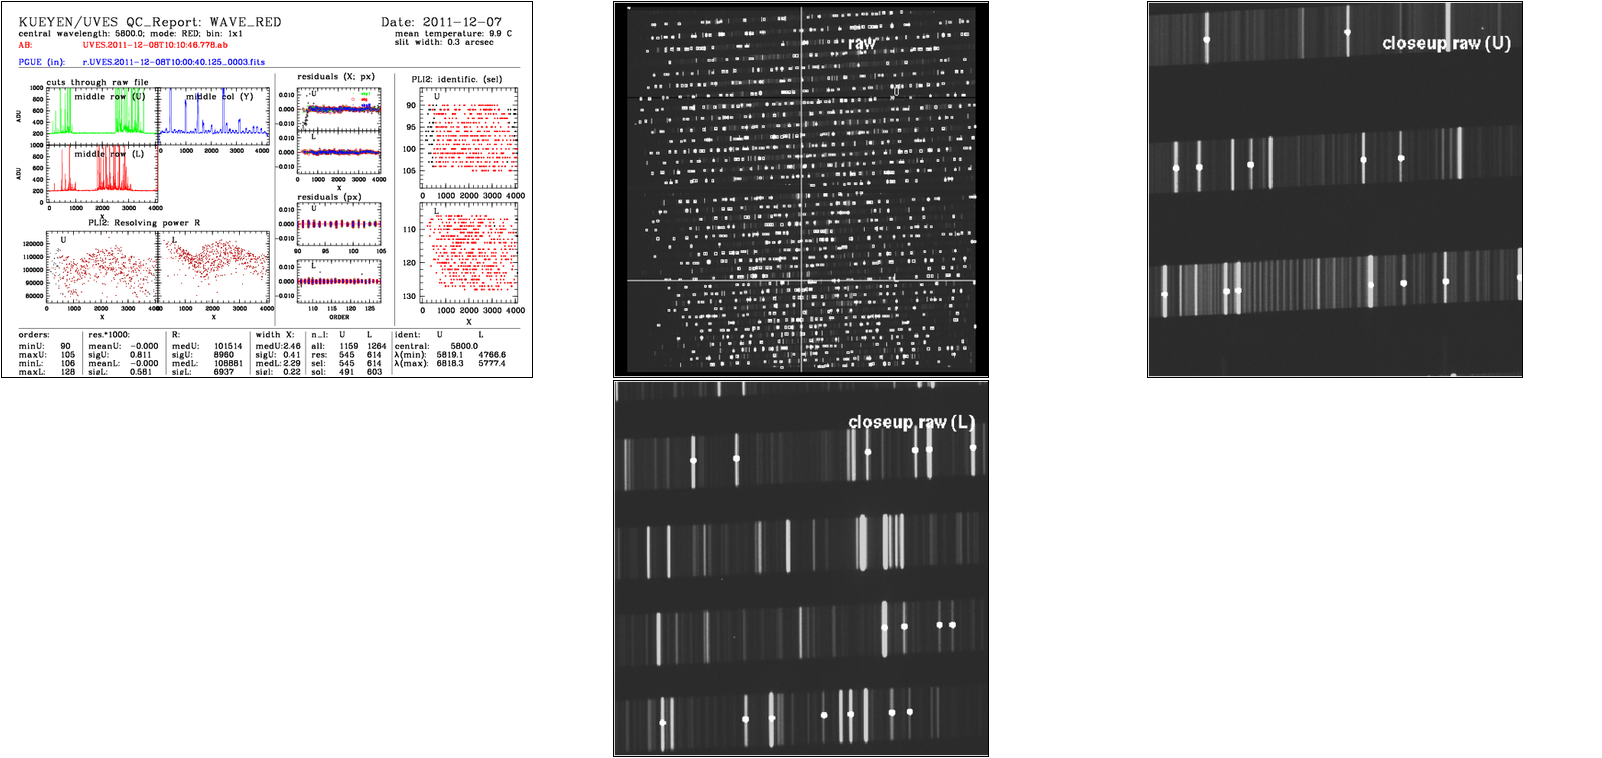
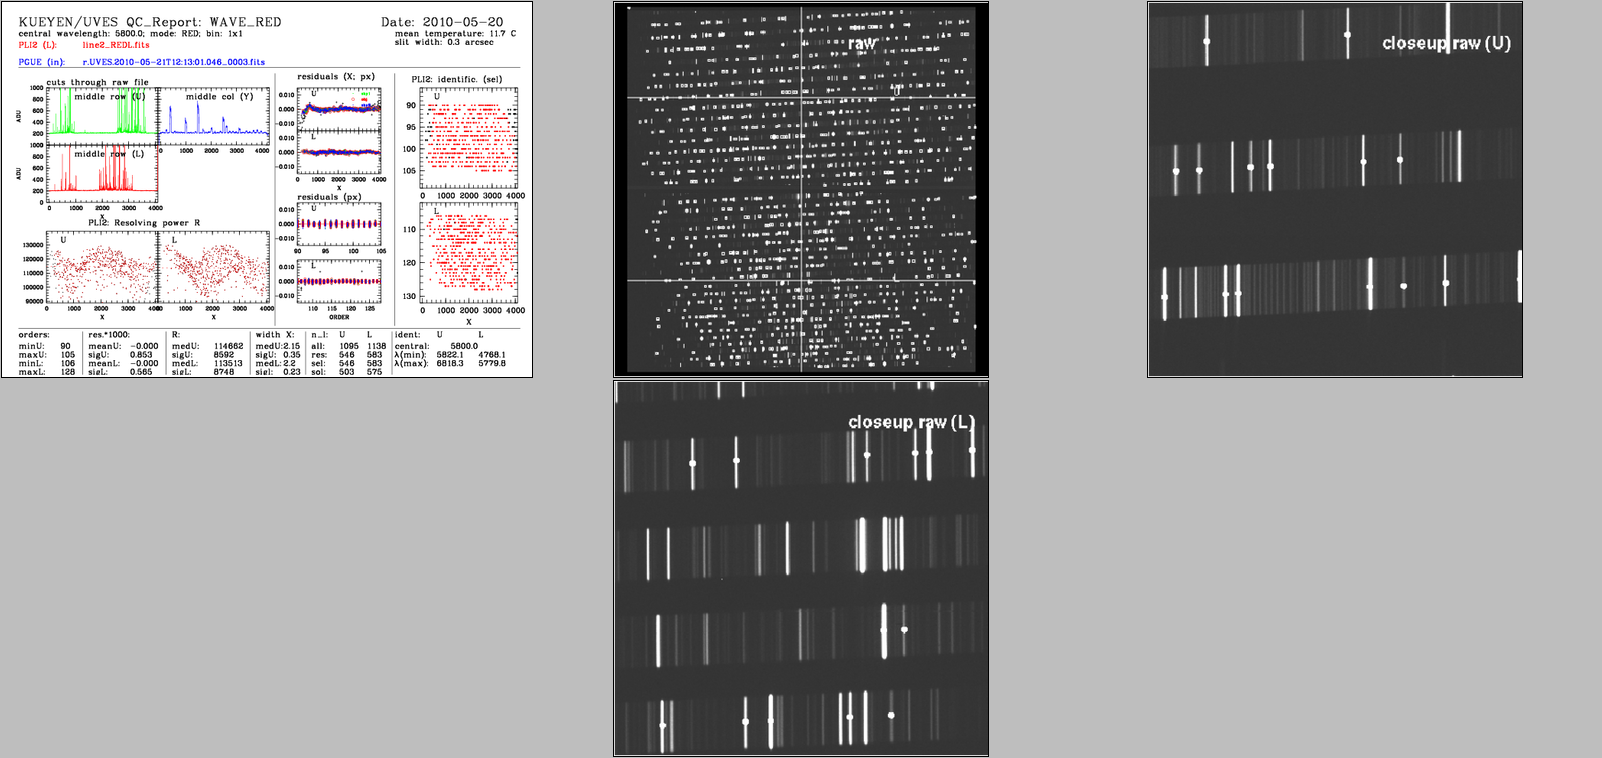
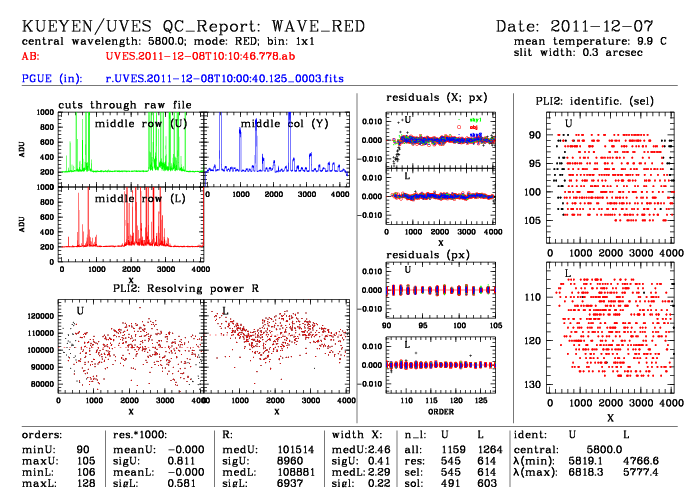
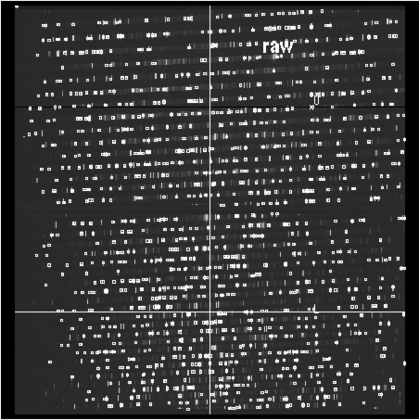
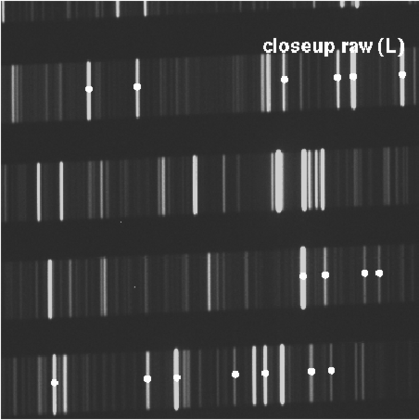
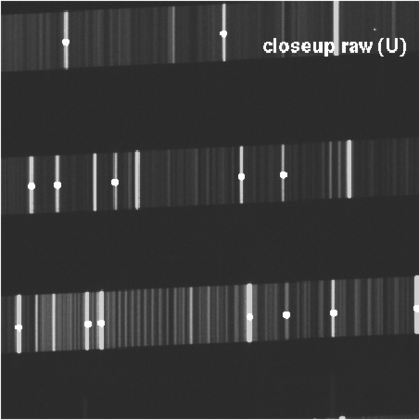
wave_ech_red.montage.png A montage image made up of the following individual reports simply for the purposes of easier/better display in XV during the certification process. Created together with the reference montage (see below) within the uves.MeasureQuality script. Can be recreated manually by calling the script uves.makeQCreportMontage -a <AB>, see uves.makeQCreportMontage -h for more details. wave_ech_red.montage.ref.png A montage image made up from the individual QC reports of the reference AB located by the script uves.getRefAB. During certification, the two montage images are blinked to facilitate identification of unusual features. This reference montage created at the same time as the AB montage (see above).The montage of the reference AB is easily identified during the blinking as the one with the grey background. wave_ech_red_0000.fits.png box 1, left to right, top to bottom: plot 1:trace across the middle row of the UPPER chip RAW frame plot 2:trace across the middle column of the RAW frames (ie both chips 'stuck together') plot 3:trace across the middle row of the LOWER chip RAW frame plot 4:measured resolving power of each line used in the solution for the UPPER chip as a function of X plot 5:measured resolving power of each line used in the solution for the LOWER chip as a function of X box 2, top to bottom: plot 6:residuals of measured line positions with respect to the physical model for the UPPER chip for the order centre (red open circles) and the two so-called sky traces (one on either side of the central trace) (green and blue crosses) as a function of X pixels coordinate plot 7:residuals of measured line positions with respect to the physical model for the LOWER chip for the order centre (red open circles) and the two so-called sky traces (one on either side of the central trace) (green and blue crosses) as a function of X pixels coordinate plot 8:residuals of measured line positions with respect to the physical model for the UPPER chip for the order centre (red open circles) and the two so-called sky traces (one on either side of the central trace) (green and blue crosses) as a function of order number plot 9:residuals of measured line positions with respect to the physical model for the LOWER chip for the order centre (red open circles) and the two so-called sky traces (one on either side of the central trace) (green and blue crosses) as a function of order number box 3, top to bottom: plot 10:pixel-space representation of found but not used (black) and found and used (red) in the solution lines as a function of order for the UPPER chip plot 11:pixel-space representation of found but not used (black) and found and used (red) in the solution lines as a function of order for the UPPER chip wave_ech_red_0000.fits_1.ima.png MIDAS display of the RAW frame (both chips) with the located emission lines indicated by filled circle symbols wave_ech_red_0000.fits_2.ima.png closeup of MIDAS display of the LOWER chip RAW frame with the located emission lines indicated by filled circle symbols wave_ech_red_0000.fits_3.ima.png closeup of MIDAS display of the UPPER chip RAW frame with the located emission lines indicated by filled circle symbols | |||||||||||||||||||||||||||
| QC1PARAM |
QC1 parameters written into QC1 table: QC1db names: lambda_min | lambda_max | order_min | order_max | order_min_det | order_max_det | resid_avg | resid_rms | resol_med | resol_rms | fwhm_med | fwhm_rms | nlin_tot | nlin_res | nlin_sel | nlin_sol | nlin_tot_1stiter | nlin_niters | nlin_int | int_avg | ins_temp4_mean FITS key names: QC.WLENMIN | QC.WLENMAX | QC.ORDMIN | QC.ORDMAX | QC.ORDMAX | QC.ORDMIN.DETECTED | QC.ORDMAX.DETECTED | QC.LINE.RESIDAVG | QC.LINE.RESIDRMS | QC.RESOLMED | QC.RESOLRMS | QC.FWHMMED | QC.FWHMRMS | QC.NLINTOT | QC.NLINRES1 | QC.NLINSEL | QC.NLINSOL | QC.TRACE0.WIN2.NLINDET1 | QC.TRACE0.WIN2.NLINDET.NITERS | QC.NLININT | QC.INTAVG | INS.TEMP4.MEAN QC1 params created by pipeline: All QC1 params created by this procedure: None | |||||||||||||||||||||||||||
| ALGORITHM |
Description of algorithms: Algorithms for pipeline created keywords are (in principal) described in the pipeline user's manual
| |||||||||||||||||||||||||||
| CERTIF |
Reasons for rejection:
| |||||||||||||||||||||||||||
| COMMENTS | The threshold adjustment iteration algorithm can play havoc with the QC1 parameters. A tiny change in flux level can result in transitioning from, say, 3 to 2 iterations which can then result in large changes in number of lines found/used, minimum and maximum wavelengths, even number of orders found in solution, and somehow such changes also seem to affect the measured resolution and residual rms. | |||||||||||||||||||||||||||
| top | [2015-10-30T08:21:08] created by qcDocu v1.1.2, a tqs tool | |||||||||||||||||||||||||||