mirror sites: PL (internal link) HQ     [?]

Health Check monitor


CAL | HC | refs | QC
HealthCheck Monitor
   HOME | UsersGuide
  sl icon ALL INSTRUMENTS
 
all KPI reports
FORS2:
lamps: arcs+flats
Other HC:
QC links:
        [page auto-refreshes after 300 sec]   [stop | on]            [press Ctrl+Shift+R to enforce refresh of scores, dates and news]
FORS2 trending system: HEALTH CHECK report
HELP USERS-GUIDE MORE
Last update: 2024-04-28T18:26:18 (UT)
  | now: 2024-04-29T05:38:16 (UT) muc01 QC pipeline: fors-5.6.10 (installed 2024-04-19)
same group: FFB12 FFB34 FFR34   Ar12 HeHgCd Ne12
General news: NOTE: The Health Check and calChecker services are moved to qcFlow on an instrument by instrument basis. The current pages will not be updated any longer once the move has been finished.
FORS2 news:  
Report news:
DATE*: [?] 2024-04-22
report | NLT
2024-04-23
report | NLT
2024-04-24
no data | NLT
2024-04-25
no data | NLT
2024-04-26
report | NLT
2024-04-27
report | NLT
2024-04-28
report | NLT
r...
Raw CAL displays:
raw raw no CAL raw files no CAL raw files no CAL raw files raw raw
P...
CAL product quality:
products products no CAL products no CAL products no CAL products products products
 
transfer   ngas [?]

scores&comments | history ... | plot tutorial ... | contact | HC_docu... | quality events...               [?]
*Date on this monitor changes at 21:00 UT
png: Information and research:
- png file - advanced studies: QC1 browser | QC1 plotter
Plot
?
Symb
?
Source
*
Average ? Thresholds ? N_
data
QC1
parameter
Data
downloads
Remarks
method value unit method value
1 QC1DB MEDIAN 0.666 ADU VAL0.2,1.2 135 flux this | last_yr | all normalized flux of He+1 lamp for chip 1
2 QC1DB MEDIAN 0.831 ADU VAL0.16,1.2 135 flux this | last_yr | all normalized flux of He+1 lamp for chip 2
3 QC1DB MEDIAN 1.72 ADU VAL1.0,2.7 135 flux this | last_yr | all normalized flux of HgCd+2 lamp for chip 1
4 QC1DB MEDIAN 1.53 ADU VAL0.55,2.4 135 flux this | last_yr | all normalized flux of HgCd+2 lamp for chip 2
*Data sources: QC1DB: QC1 database; LOCAL: local data source
Plot 1
scores: 2|
data source:fors2_lamp_chk
(QC1 database)
dataset:flux
median:0.666ADU
fixed thresholds:0.2...1.2ADU
N_data plotted:135
[click plot for closeup]
Plot 2
scores: 2|
data source:fors2_lamp_chk
(QC1 database)
dataset:flux
median:0.831ADU
fixed thresholds:0.16...1.2ADU
N_data plotted:135
[click plot for closeup]
Plot 3
scores: 2|
data source:fors2_lamp_chk
(QC1 database)
dataset:flux
median:1.72ADU
fixed thresholds:1.0...2.7ADU
N_data plotted:135
[click plot for closeup]
Plot 4
scores: 2|
data source:fors2_lamp_chk
(QC1 database)
dataset:flux
median:1.53ADU
fixed thresholds:0.55...2.4ADU
N_data plotted:135
[click plot for closeup]
This plot

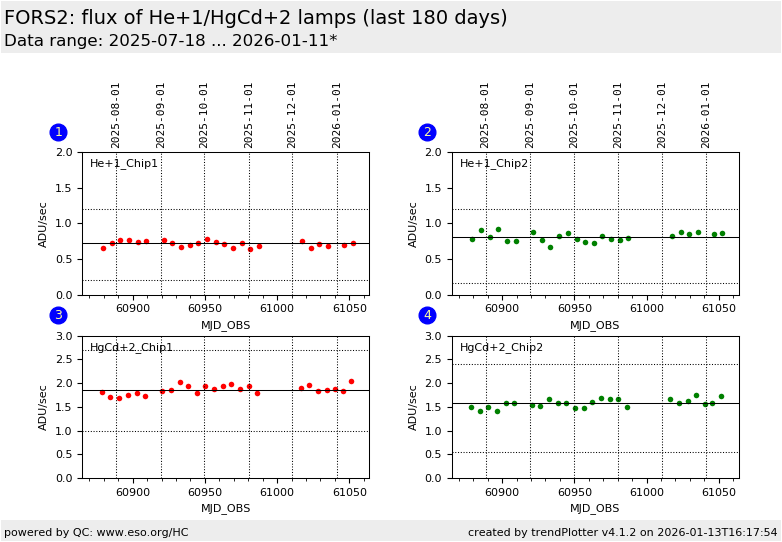
This parameter is determined from an overscan-subtracted calibration lamp exposure in LSS mode (taken with the template FORS2_lss_tec_waveLampcheck). The total signal is integrated and normalized by the exposure time and the total number of original CCD pixels (keeping into account possible binning). More information can be found in the plot tutorial.

DB Name: fors2_lamp_chk
TPL.ID: FORS2_lss_tec_waveLampcheck
QC1 DB parameter: flux

 
General information

Click on any of the plots to see a close-up version.

The latest date is indicated on top of the plot.

If configured,

  • data points belonging to the latest date are specially marked
  • statistical averages are indicated by a solid line, and thresholds by broken lines
  • outliers are marked by a red asterisk. They are defined as data points outside the threshold lines
  • "aliens" (= data points outside the plot Y limits) are marked by a red arrow ( or )
  • you can download the data for each parameter set if the 'Data downloads' link shows up