Plot
? |
Symb
? |
Source
* |
Average ? |
Thresholds ? |
N_
data |
QC1
parameter |
Data
downloads |
Remarks |
| method |
value |
unit |
method |
value |
| 1 |
• | QC1DB |
none |
|
NONE |
none | |
1553 |
respow2 |
all (full time range)
| resolving power in 1.1237 second arc line |
| 2 |
• | QC1DB |
none |
|
NONE |
none | |
1439 |
respow2 |
all (full time range)
| resolving power in 1.1237 second arc line |
| |
|
*Data sources: QC1DB: QC1 database; LOCAL: local data source
|
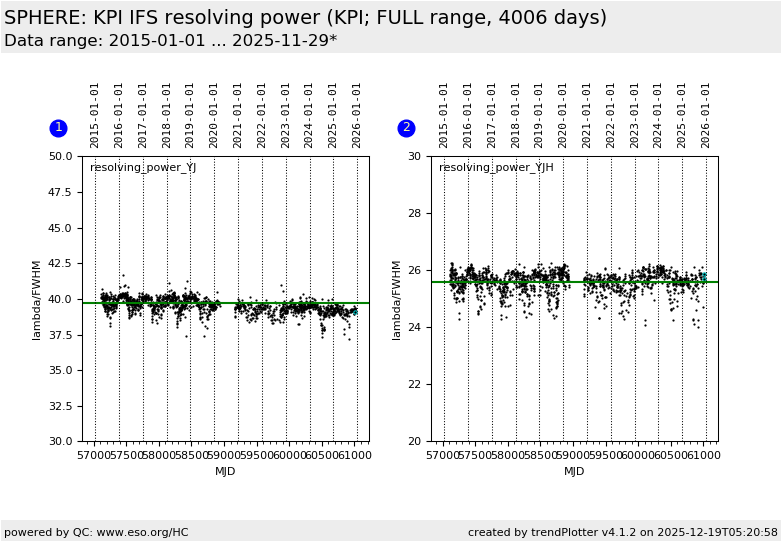
| Plot 1 | | data source: | sphere_ifs_wave
(QC1 database) |
| dataset: | respow2 | • |
| average: | none |
| thresholds: | none |
| N_data plotted: | 1553 |
| (current) reference: | 39.7 |
| [click plot for closeup] |
| Plot 2 | | data source: | sphere_ifs_wave
(QC1 database) |
| dataset: | respow2 | • |
| average: | none |
| thresholds: | none |
| N_data plotted: | 1439 |
| (current) reference: | 25.6 |
| [click plot for closeup] |
According to
- VLT-SPE-SPH-14690-0083 (SPHERE Technical Specification)
- VLT-SPE-SPH-14693-0082 (SPHERE Technical Specification)
- VLT-MAN-SPH-14690-0430 P104.0
This plot shows the resolving power of the IFS arm for both prism JY
and JYH. Of the up the four available laser arc lines, only the resolving
power (R = lambda / delta lambda, where delta lambda is the FWHM) of the
1.1237 mu laser (respow2) is shown. The pipeline cube product is median
collapsed in both spatial directions (border regions are omitted) and the
resulting arc spectrum is analysed via a Gaussian fit to each of the 3-4 the arc lines.
The resolving power is specified in the TLR documents to R=15, while
the IFS arm performs better at (long-term average): 39.7 (YJ) and 25.6
(YJH), which are used as reference values in the KPI plot.
General information
Click on any of the plots to see a close-up version.
The latest date is indicated on top of the plot.
If configured,
- data points belonging to the latest date are specially marked
- statistical averages are indicated by a solid line, and thresholds by broken lines
- outliers are marked by a red asterisk. They are defined as data points outside the
threshold lines
- "aliens" (= data points outside the plot Y limits) are marked by a red arrow (↑ or ↓)
- you can download the data for each parameter set if the 'Data downloads' link shows up
|
